The Energy sector ranks seventh out of the ten major sectors as detailed in our sector roadmap. It gets my Dangerous rating, which, like my fund ratings, is based primarily on aggregation of stock ratings for each of the 191 companies in the sector. The Energy sector is near the bottom of the sector barrel. The full series of my reports on the Best & Worst Sector and Style Funds is here.
Per Figure 1, Energy sector stocks do not look that bad. Over 40% of the market cap of the sector gets my Attractive rating. The problem is that fund managers in the sector are not allocating enough of their portfolios to the Attractive stocks. Nearly 99% of Energy fund assets get my Dangerous-or-worse rating.
Investors should sell funds in this sector because the cost of portfolio management (active or passive) is not justified. Investors can outperform by picking better stocks on their own while also avoiding the costs of putting money into a fund.
Figure 1: Energy Sector Landscape For Funds & Stocks
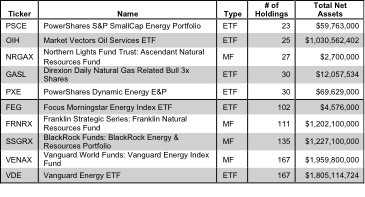
If you are forced to choose a fund in the Energy sector, know that all 97 funds are very different. Per Figure 2, the number of holding varies widely (from 23 to 167), which creates drastically different investment implications and ratings. Here is the full list of 97 funds.
How do investors pick the right fund out of the sea of choices that will deliver the best returns?
Figure 2: Funds with Most & Least Holdings – Top 5
To identify the best funds within a given category, investors need a predictive rating based on analysis of the underlying quality of stocks in each fund. See Figure 3.
Our predictive fund ratings are based on aggregating our stock ratings on each of the fund’s holdings and all of the fund’s expenses. Investors deserve forward-looking fund research that is comparable in quality to stock research.
Investors should not rely on backward-looking research of past performance for investment decisions.
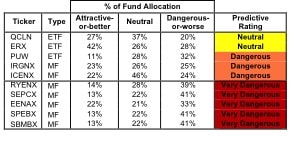
Figure 3 shows the five best and worst-rated funds for the sector. No funds allocate enough value to Attractive-rated stocks to earn an Attractive-or-better rating. Direxion Daily Energy Bull 3X Shares [s: ERX] does allocate 42% of its value to Attractive-rated stocks but earns my Neutral rating because of its high allocation to Dangerous-or-worse rated stocks. In addition to stock selection, my ratings account for the total annual cost of investing in a fund or ETF. My ratings (updated daily) on all funds in this sector are here.
One of my favorite stocks in the Energy sector is Exxon Mobile [s: XOM], which gets my Attractive rating. The fund that allocates the most (at 27%) to XOM is [s: ERX] though it gets a Neutral rating. Performance of XOM has been up and down over the past few years – kind of like our economy. When it gets cheap, it is hard to pass up given its leadership in the Energy sector. Most will agree that demand for energy is on the rise for the foreseeable future. Yet XOM’s current valuation (~$83.74/share) implies the company will not grow its profits more than 10% over the remainder of its corporate life. That seems a bit pessimistic for the world’s largest publicly-traded international oil and gas company. It is also one of the most profitable companies in the world.
One of my least favorite Energy stocks is Baker Hughes [s: BHI], which gets my Very Dangerous rating. I also recommend investors sell Fidelity Select Portfolios: Energy Service Portfolio [s: FSESX], the fund that allocates the most (about 8%) to BHI. Investors should sell BHI because of its overstated earnings and expensive valuation. BHI’s accounting earnings have benefited significantly from the BJ Services acquisition that closed in late April 2010. However, the economics, i.e. the resulting cash flows, of the deal are not positive. One of the biggest misconceptions in the investing world is that the merit of an acquisition should be judged by whether or not it is “earnings accretive”. As I detailed in this report, the impact of an acquisition on accounting earnings is not indicative of its economic value to shareholders. Though the stock has fallen from ~$58 to ~$49 since I wrote the afore-mentioned report, it is still on my Most Dangerous Stocks list, The current valuation implies the company will grow, organically, its after-tax cash flow (NOPAT) by over 20% compounded annually for 10 years. That seems a bit of a stretch.
Figure 3: Funds with the Best & Worst Ratings – Top 5
 * MF designates Mutual Funds and ETF designates Exchange-Traded Funds
Sources: New Constructs, LLC and company filings
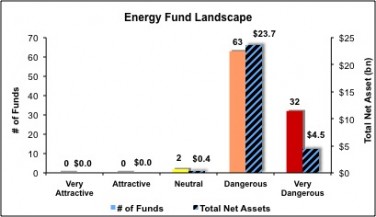
Investors should avoid all Energy funds. 95 of the 97 funds allocate enough value to Dangerous-or-worse-rated stocks to earn a Dangerous-or-worse rating. Figure 4 shows the rating landscape of all ETFs and mutual funds in the Energy sector.
Our Sector Roadmap report ranks all sectors and highlights those that offer the best investments.
Figure 4: Separating the Best Funds From the Worst
Figure 5 lists our Predictive Fund Rating for the 5 largest and most popular Energy funds.
Figure 5: Five Largest Energy Funds
 * MF designates Mutual Funds and ETF designates Exchange-Traded Funds
* Analysis uses the top-ranked class for each fund
Sources: New Constructs, LLC and company filings
The full list of Energy funds and our ratings on each fund is here.
Disclosure: I receive no compensation to write about any specific stock, sector or theme.


