There are no Attractive-rated investment styles. The primary driver behind the Neutral-or-worse ratings is poor portfolio management. Fund managers are simply not picking stocks well. More details in my article “A Cheap Fund Is Not Always a Good Fund”. Articles on all style and sector funds are here.
Investors looking for the best style funds should look no further than the All Cap and Large Cap styles. See Figure 1. Only these styles house any Attractive-or-better rated funds. My style ratings are based on the aggregation of my ratings for each fund in each style. Soon to follow are detailed reports on the best and worst funds in each style, similar to my best and worst sector fund articles.
See Figures 4 through 13 for a detailed breakdown of ratings distributions by investment style. See our fund screener for rankings and ratings along with free reports on all 7400+ mutual funds and ETFs.
Figure 1: Ratings For All Investment Styles
 Source: New Constructs, LLC and company filings
To earn an Attractive Predicitve Rating, a fund must have high-quality holdings and low costs. Only 87 investment style funds meet these requirements and receive our Attractive-or-better rating, which is less than 2% of funds.
Sterling Capital Funds: Sterling Capital Equity Income Fund [s: BEGIX] is my top large cap value fund. It gets an Attractive rating as does the Hennessy Funds Trust: Hennessy Cornerstone Large Growth Fund [s: HILGX], my top all cap blend fund.
One of my favorite stocks in BEGIX is Travellers [s:TRV]. It generates strong economic earnings and has a great valuation. Its current stock price (~$59.39) implies the company’s profits will permanently decline by 30%. That is the kind of risk/reward I like. One of my favorite stocks in HILGX is Humana [s: HUM]. I am bullish on the health care sector and HUM is one of the best stocks in that sector. An ROIC of 12% is excellent for a hospital yet the valuation of the stock does not seem to care. At ~$90.28, the stock’s valuation implies the company will never grow its after-tax cash flow (NOPAT) beyond its current level. Again, that is the kind of risk/reward I like.
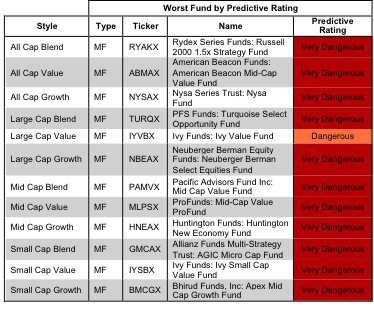
Ivy Funds: Ivy Small Cap Value Fund [s: IYSBX] is the worst small cap value fund and gets my Very Dangerous rating. The Portfolio Management rating for this fund is Dangerous and the Total Annual Cost Rating is Very Dangerous, resulting in a lose-lose value proposition for investors. The managers at IYSBX have a lot of nerve charging an investor over 5% per year over 3 years.
One of my least favorite stocks in this fund is Triumph Group, Inc. [s: TGI]. It gets my Very Dangerous rating because of misleading earnings and an expensive valuation. The company’s ROIC is 7%, well below its cost of capital. To justify its valuation, the stock at $63 implies the company will grow its profits at 10% compounded annually for 15 years. Good luck.
Figure 2 shows the distribution of our Predictive Ratings for all investment style ETFs and mutual funds.
Figure 2: Distribution of Funds and Assets by Predictive Rating
 Source: New Constructs, LLC and company filings
Figure 3 offers additional details on the quality of the investment style funds. Note that the average Total Annual Cost of Very Dangerous funds is almost 7 times that of Very Attractive funds.
Figure 3: Predictive Rating Distribution Stats
 * Avg TAC = Weighted Average Total Annual Costs
Source: New Constructs, LLC and company filings
This table shows that only the best of the best funds get our Very Attractive Rating: they must hold good stocks AND have low costs. Investors deserve to have the best of both and I am here to give it to them.
Figure 4 presents a mapping of Very Attractive funds by investment style. The chart shows the number of Very Attractive funds in each investment style and the percentage of assets allocated to Very Attractive-rated funds in each style.
Only 4 investment style funds earn our Very Attractive rating.
Figure 4: Distribution of Very Attractive Funds by Investment Style
 Source: New Constructs, LLC and company filings
Figure 5 presents the data charted in Figure 4.
Figure 5: Distribution of Very Attractive Funds by Investment Style
 Source: New Constructs, LLC and company filings
Figure 6 presents a mapping of Attractive funds by investment style. The chart shows the number of Attractive funds in each investment style and the percentage of assets allocated to Attractive-rated funds in each style.
Note that the Large Cap and All Cap styles are the only styles to houses Attractive-rated funds. Investors should avoid purchasing any Small and Mid Cap funds.
Figure 6: Distribution of Attractive Funds by Investment Style
 Source: New Constructs, LLC and company filings
Figure 7 presents the data charted in Figure 6.
Figure 7: Distribution of Attractive Funds by Investment Style
 Source: New Constructs, LLC and company filings
Figure 8 presents a mapping of Neutral funds by investment style. The chart shows the number of Neutral funds in each investment style and the percentage of assets allocated to Neutral-rated funds in each style.
Figure 8: Distribution of Neutral Funds by Investment Style
 Source: New Constructs, LLC and company filings
Figure 9 presents the data charted in Figure 8.
Figure 9: Distribution of Neutral Funds by Investment Style
 Source: New Constructs, LLC and company filings
Figure 10 presents a mapping of Dangerous funds by fund style. The chart shows the number of Dangerous funds in each investment style and the percentage of assets allocated to Dangerous-rated funds in each style.
Every investment style except the Large Cap Blend, Large Cap Growth, and All Cap Blend styles has over 20% of its value invested in Dangerous-rated funds.
Figure 10: Distribution of Dangerous Funds by Investment Style
 Source: New Constructs, LLC and company filings
Figure 11 presents the data charted in Figure 10.
Figure 11: Distribution of Dangerous Funds by Investment Style
 Source: New Constructs, LLC and company filings
Figure 12 presents a mapping of Very Dangerous funds by fund style. The chart shows the number of Very Dangerous funds in each investment style and the percentage of assets allocated to Very Dangerous-rated funds in each style.
The Small Cap Value investment style has 10% of its value invested in funds with Very Dangerous ratings.
Figure 12: Distribution of Very Dangerous Funds by Investment Style
 Source: New Constructs, LLC and company filings
Figure 13 presents the data charted in Figure 12.
Figure 13: Distribution of Very Dangerous Funds by Investment Style
 Source: New Constructs, LLC and company filings