The All Cap Blend investment style ranks second out of the twelve investment styles as detailed in our style roadmap. It gets my Neutral rating, which is based on aggregation of fund ratings of all 661 funds in the style. Articles on all style and sector funds are here.
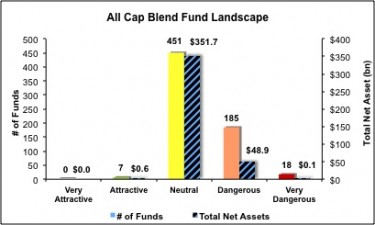
Per Figure 1, there are 496 out of the 2,828 stocks (over 26% of the market cap) held by large cap blend funds that get an Attractive-or-better rating. However, only 7 out of 661 funds (less than 0.2% of total net asses) in the style get an Attractive-or-better rating.
As detailed in “Cheap Funds Dupe Investors”, the fund industry offers many cheap funds but very few funds with high-quality stocks, or what I call good portfolio management. Over 95% of all style funds get low portfolio management ratings and do not justify their costs.
Investors cannot assume that cheap funds are good investments. Research on the underlying holdings of a fund is necessary for an informed decision.
Figure 1: All Cap Blend Style Landscape For Funds & Stocks
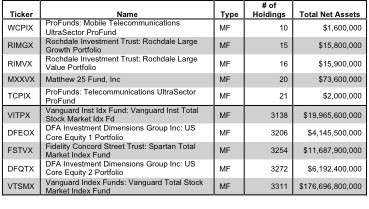
There are 661 funds to chose from within the All Cap Blend style, and they are all very different. Per Figure 2, the number of holding varies widely (from 10 to 3311), which creates drastically different investment implications and ratings. Here is the full list of 661 funds.
How do investors pick the right fund out of the sea of choices that will deliver the best returns?
To identify the best funds within a given category, investors need a predictive rating based on analysis of the underlying quality of stocks in each fund. See Figure 3.
My predictive fund ratings are based on aggregating (1) my stock ratings on each of the fund’s holdings and (2) all of the fund’s expenses. Investors should not rely on backward-looking research of past performance for investment decisions.
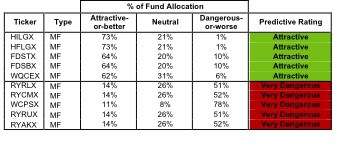
Figure 3 shows the five best and worst-rated funds for the style. The best funds allocate more value to Attractive-or-better-rated stocks than the worst funds and vice versa. The worst funds have high total annual cost and hold poor stocks. My ratings (updated daily) on all funds in this style are here.
Figure 3: Funds with the Best & Worst Ratings – Top 5
 * MF designates Mutual Funds and ETF designates Exchange-Traded Funds
Sources: New Constructs, LLC and company filings
My top-rated all cap blend fund is Hennessy Funds Trust: Hennessy Cornerstone Large Growth Fund [s: HILGX]. One of its largest holdings and part of the 73% it allocates to Attractive-or-better stocks is Humana [s: HUM]. I am bullish on the health care sector and HUM is one of the best stocks in that sector. An ROIC of 12% is excellent for a hospital yet the valuation of the stock does not seem to care. After its recent drop to ~$86.17, the stock’s valuation implies the company’s after-tax cash flow (NOPAT) will permanently decline by over 10%. That is the kind of risk/reward I like.
My worst-rated all cap blend fund is Rydex Series Funds: Russell 2000 1.5x Strategy Fund [s: RYAKX] One of its largest holdings and part of the 52% it allocates to Dangerous-or-worse stocks is SuccessFactors Inc. [s: SFSF], which gets my Dangerous rating. SFSF’s ROIC is negative so the company is bleeding cash. Equity investors should take note that as the business drains its cash reserves, management is promising chunks of this precious asset to lessors. Investors should also not that the company’s balance sheet is misleading. It does not show the $15 million of operating lease obligations that the company is allowed to hide off-balance sheet. Though $15 million is a relatively small number, the direction taken in management’s approach to its reported financials is not encouraging.
Lastly, the stock’s valuation seems way too high to me. At about $40/share, the current price implies the company will grow its profits at over 40% compounded annually for at least 10 years. That is setting a rather high hurdle for a management team that appears focused on managing accounting earnings instead of economic earnings.
Investors need to tread carefully when considering All Cap Blend funds, as most are not worth buying. Only 7 of the 661 funds for the style allocate enough value to Attractive-or-better-rated stocks to earn an Attractive rating. Figure 3 shows the rating landscape of all ETFs and mutual funds in the All Cap Blend style.
Our style roadmap report ranks all styles and highlights those that offer the best investments.
Figure 4: Separating the Best Funds From the Worst
Figure 5 lists our Predictive Fund Rating for the 5 largest and most popular All Cap Blend funds.
Figure 5: Five Largest All Cap Blend Funds
 * MF designates Mutual Funds and ETF designates Exchange-Traded Funds
* Analysis uses the top-ranked class for each fund
Sources: New Constructs, LLC and company filings
The full list of All Cap Blend funds and our ratings on each fund is here.
Disclosure: I receive no compensation to write about any specific stock, sector or theme.


