The all-cap growth investment style ranks fifth out of the twelve fund styles as detailed in style roadmap. It gets my Neutral rating, which is based on aggregation of my ratings on 465 all-cap growth funds. Reports on the Best & Worst funds in every style and sector are here.
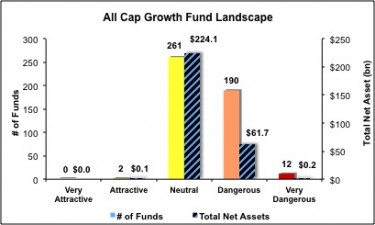
Per Figure 1, only 2 of the 465 all-cap growth funds (less than 1% of total net assets) are investment worthy. Digging further, 1873 stocks (over 60% of the market cap) held by all-cap growth funds get a Neutral-or-worse rating. The takeaway is: fund managers are overweighting poor quality stocks.
Investors seeking exposure to all-cap growth stocks should buy a basket of Attractive-or-better rated stocks and avoid paying underserved fund fees.
As detailed in “Cheap Funds Dupe Investors”, the fund industry offers many cheap funds but very few funds with high-quality stocks, or with what I call good portfolio management.
Figure 1: All-Cap Growth Style Landscape For Funds & Stocks
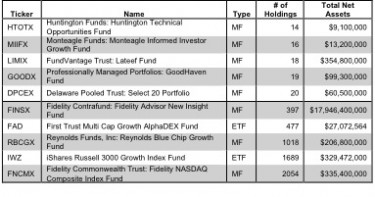
The 465 all-cap growth funds are all very different. Per Figure 2, the number of holding varies widely (from 14 to 2054), which creates drastically different investment implications and ratings. Review my full list of ratings and free reports on all 465 funds.
How do investors pick the fund that will deliver the best returns?
Figure 2: Funds with Most & Least Holdings – Top 5
To identify the best funds within a given category, investors need a predictive rating based on analysis of the underlying quality of stocks in each fund. See Figure 3.
My predictive fund ratings are based on aggregating (1) my stock ratings on each of the fund’s holdings and (2) all of the fund’s expenses. Investors should not rely on backward-looking research.
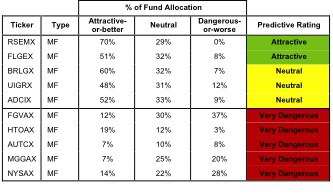
Figure 3 shows the five best and worst-rated funds for the style. The best funds allocate significantly more value to Attractive-or-better-rated stocks than the worst funds. The worst funds have poor quality holdings and do not justify their high total annual cost. For example, Nysa Series Trust: Nysa Fund [s: NYSAX] has a total annual cost of 7.12%. Ouch. My ratings and free reports (updated daily) on all 465 funds are here.
Figure 3: Funds with the Best & Worst Ratings – Top 5
 * MF designates Mutual Funds and ETF designates Exchange-Traded Funds
Sources: New Constructs, LLC and company filings
My top-rated all-cap growth fund is Royce Fund: Royce Special Equity Multi-Cap Fund [s: RSEMX], which gets my Attractive rating. RSEMX allocates 0% to Dangerous-or-worse stocks and 70% to Attractive-or-better stocks. Ergo, this fund gets an Attractive Portfolio Management rating. One of its largest holdings is Cisco Systems [s: CSCO], which gets my Attractive rating. I am bullish on the tech sector and CSCO is one of the best stocks in that sector. Like my other favorites stocks in the sector, CSCO has a strong ROIC at 14%. Moreover, ROIC has exceeded its cost of capital for each of the past eight years. The company has a very strong competitive position and $44.5 billion (40% of market cap) in excess cash.
Yet CSCO’s valuation is cheap. The current stock price (~$20.43) implies the company’s after-tax cash flow (NOPAT) will permanently decline by 6%. The no-growth value of the stock is $21.60. Despite delivering a 45% return over the last six month, this cash cow’s stock has room for more upside.
My worst-rated all-cap growth fund is Nysa Series Trust: Nysa Fund [s: NYSAX] This fund’s Predictive rating is Very Dangerous though its Portfolio Management rating is Neutral because the Total Annual Costs, at 7.1%, gets my Very Dangerous rating. This means investors are getting charged exorbitant fees for mediocre portfolio management. Can you say index fund?
One of NYSAX’s largest holdings and part of the 28% allocated to Dangerous-or-worse stocks is Frontier Communications [s: FTR], which gets my Very Dangerous rating. I am bearish on the Telecom sector and FTR is one of the worst stocks in the sector. For 2011, FTR reported positive and rising accounting earnings while economic earnings were negative and declining. I will not know if that trend continues for 2011 until the company releases its 2011 10-K, the only place you will find a complete version of the Notes to the Financial Statements. But in FTR’s 2010 10-K, I found that the main driver behind positive and increasing earnings was a tripling in the company’s deferred tax liability (from $0.7 to $2.2 billion), which enabled FTR to understate the taxes on its accounting earnings. My economic earnings models see through this smokescreen and many others. Accounting earnings and the valuation of the stock are likely to suffer when the tax man collects. As we ordinary people know, the tax man always collects.
Investors need to tread carefully when considering all-cap growth funds, as over 99% are not worth buying. Only 2 of the 465 funds for the style allocate enough value to Attractive-or-better-rated stocks to earn an Attractive rating. Figure 4 shows the rating landscape of all-cap growth ETFs and mutual funds.
Our style roadmap report ranks all styles and highlights those that offer the best investments.
Figure 4: Separating the Best Funds From the Worst Funds
Figure 5 lists our Predictive Fund Rating for the 5 largest and most popular all-cap growth funds.
Figure 5: Five Largest All-cap Growth Funds
 * MF designates Mutual Funds and ETF designates Exchange-Traded Funds
* Analysis uses the top-ranked class for each fund
Sources: New Constructs, LLC and company filings
Review my full list of ratings and rankings along with free reports on all 465 all-cap growth funds.
Disclosure: I receive no compensation to write about any specific stock, sector or theme.


