We closed this position on February 26, 2015. A copy of the associated Position Update report is here.
Year to date, Bank Of America (BAC) stock is up nearly 45% compared to the S&P at +about 8%. BAC stock has bounced back nicely after dropping precipitously at the end of last year.
I would call the 45% bounce a “dead cat” bounce because I expect the stock to fall right back to $5/share, where it bottomed last Thanksgiving, or lower.
After combing through BAC’s 300-page 2011 10-K report filed with the SEC last Thursday, I found the business is not as good as the company would have us believe, and my rating on the stock dropped from Dangerous to Very Dangerous. BAC is also a new member of my Most Dangerous Stocks list, updated Friday March 2. See my free stock screener for ratings on 3000+ stocks updated daily.
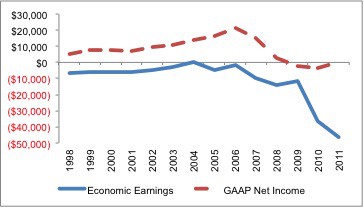
BAC’s reported earnings are misleading in 2011 because they are positive and rising while the economic earnings are negative and declining. The company reported net income of $84 million for 2011, a $3.7 billion increase over 2010’s net income of -$3.6 billion. Over $14 billion in one-time charges sank 2010’s earnings and set up the opportunity for favorable comparison for 2011’s earnings. And according to its reported results, at least, the company delivered an impressive improvement in earnings for 2011 versus 2010.
In reality, the underlying economics of the business got worse, not better in 2011. My model, which includes valuable data from the financial footnotes, shows that economic earnings fell $10 billion to -$46.6 billion in 2011 from -$36.6 billion in 2010. All details are in Appendices 2 and 3 of my report on BAC.
Figure 1: Don’t Fall For the Head Fake in Reported GAAP Results
 Sources: New Constructs, LLC and company filings
Much of the difference between the accounting and economic earnings comes from the $7.2 billion draw down in the firm’s loan loss reserves. That’s right, after a $6.1 billion draw down of reserves in 2010, the company took out another $7.2 billion or 21% of the total reserves of $33.8 billion. The drawdown of reserves reduces the company’s loan loss reserve expense and drives a rather extreme turnaround in reported earnings.
Rigorous analysis of the entire 10-K is required to uncover the true profitability of companies, and BAC is another strong example of how my due diligence in the footnotes pays off. More examples are here.
I am bearish on the financial sector, especially the big banks because they have a sordid history of accounting manipulation. As detailed in this article, Citi’s management is not above monkeying with the company’s accounting to overstate earnings. The same is true for Bank of America, which recently exploited SFAS No. 159, a new accounting rule that enables banks to artificially boost earnings when the value of their own debt declines. That’s right, this rule enables banks to boost their GAAP earnings when their credit quality deteriorates. Thank you, FASB! This loophole is just one in a long line of tricks that have enabled some of the major banks to mislead investors. More examples of 10-K insights that move stocks.
Bank of America’s has an ugly capital allocation track record as well. In the last two years, the company has written down over $15.5 billion in assets. Write-downs occur when assets on a company’s books are worth less than their depreciated purchase price. In other words, management has made the assets less valuable, after depreciation, than when they bought them. Not exactly what I call shareholder value creation. Unfortunately, BAC is not alone in such capital allocation failures.
And yet, BAC stock is pricing in tremendous value creation. At $8.12/share, the current valuation of BAC implies 20% compounded annual revenue growth for 18 years along with an improvement in ROIC from -2% to over 12% at the same time. In other words, the stock has already baked in extremely high expectations for both revenue growth and profit improvement. Those are high hurdles for a management team with a weak value-creation track record in a business facing increasing regulatory headwinds, to say the least.
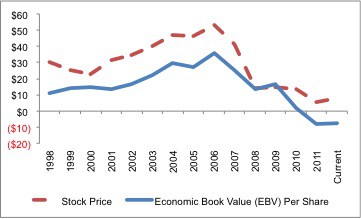
Figure 2 compares BAC’s stock price to its economic book value, which measures the equity value of the business based on its actual operating cash flow after-tax (NOPAT) net of all liabilities, including off-balance sheet debt, pensions, etc. Similar to Figure 1, which showed GAAP earnings as positive and rising while economic earnings were negative and declining, this chart shows BAC’s stock price as positive and rising while the economic book value is negative and declining. This is not a good sign for current BAC shareholders. Stock prices may track accounting earnings for a while, but, eventually, they follow the cash flows.
One could also argue that the stock price is returning to a more normal premium to the economic book value of the company. However, it is difficult to argue that the company’s future prospects are anywhere close to as promising as they were back at the turn of the century.
I prefer to argue that management will not succeed in generating anywhere near the value implied by the current valuation of the stock and the overvaluation of BAC’s stock is coming to an end.
After all, it is difficult to grow a business that is running off its customers. As detailed in “Raising Fees Is A Desperate Measure: Sell BAC“, management at BAC is struggling mightily to keep this business out of the gutter. The latest decision to raise fees on checking customers threatens to degrade one of the few assets the company has left, its customers.
In addition to selling BAC stock, I recommend investors sell and/or avoid the following ETFs and funds because they make large allocations to BAC and get my Very Dangerous predictive fund rating.
- RevenueShares Financials Sector Fund [s: RWW] – 11% allocation to BAC
- ProFunds: Banks UltraSector ProFund [s: BKPSX] and [s: BKPIX] – 8% allocation to BAC
- PowerShares KBW Bank Portfolio [s: KBWB] – 8% allocation to BAC
- Fidelity Select Portfolios: Brokerage & Investment Management Portfolio [s: FSLBX] – 5% allocation to BAC
- Fidelity Advisor Series VII: Fidelity Advisor Financial Services Fund [s: FAFSX] – 5% allocation to BAC (note the “C” and “I” shares only get my Dangerous rating.
New Constructs’ free fund screener provides my ratings and reports on all financial services ETF and funds.
Disclosure: I receive no compensation to write about any specific stock, sector or theme.

2 replies to "Sell BAC: Management Is Running Out of Gimmicks"
I own KBWB and is is currently on the very attractive ETF list, but the Sell BAC: Management Is Running Out of Gimmicks article recommends due to the dead cat bounce of BAC that I sell/avoid that very same ETF. That raises questions in my mind about the contrarian forecasting your service provides. How can you on one hand recommend very strongly to BUY and on the other hand recommend sell /avoid. I understand that KBWB has other holdings but the recommendations are still present
Please clarify (if possible).
Regards,
Boris Stefanoff
Mr. Stefanoff,
At the time this article was written in 2012, KBWB had a Very Dangerous rating. Since then, its holdings have improved and it now earns our Very Attractive rating. That’s in part to the improvement in the ratings of stocks such as BAC, which now earns our Neutral rating, and the change in the weighting of its holdings. BAC is no longer weighted as heavily in KBWB’s portfolio, and other stocks that earn our Attractive rating now factor more heavily in its holdings.