This report focuses on my top picks and pans for all sector funds. I will follow this summary with a detailed report on each sector.
My top ETFs and mutual funds have high-quality holdings and low costs. As detailed in “Low-cost funds dupe investors”, there are few funds that have both good holdings and low costs. While there are lots of cheap funds, there are very few with high-quality holdings.
I think there are at least two causes for this disconnect. First, there is, in general, a lack of independent research on ETFs and funds. Second, I think it is fair to say that there is a severe lack of quality research into the holdings of mutual funds and ETFs. There should not be such a large gap between the quality of research on stocks and funds, which are simply groups of stocks.
After all, investors should care more about the quality of a fund’s holdings than its costs because the quality of a fund’s holdings is the single most important factor in determining its future performance.
My Predictive Rating system rates 7400+ ETFs and mutual funds according to the quality of their holdings (Portfolio Management Rating) and their costs (Total Annual Costs Rating).
Figures 1 shows the best ETF or mutual fund in each sector as January 23rd, 2013.
For a full list of all ETFs and mutual funds for each sector ranked from best to worst, see my free ETF & mutual fund screener.
Figure 1: Best ETF or Mutual Fund In Each Sector
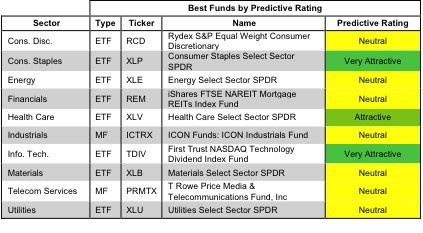 Source: New Constructs, LLC and company filings
Consumer Staples Select Sector SPDR (XLP) is the highest rated ETF we cover, and one of only six ETFs or mutual funds to earn our five star rating. Low costs are important (Total Annual Costs of 0.2% ranks in 86th percentile), but high quality holdings are the key to XLP’s Very Attractive rating.
Over 74% of XLP’s portfolio is allocated to companies that earn our Attractive or Very Attractive rating. Less than 3% is allocated to stocks rated Dangerous or Very Dangerous. This has helped it to outperform the SPDR S&P 500 for the past five years despite the low-growth, conservative reputation of the consumer staples sector.
XLP’s largest holding is Procter & Gamble (PG). The consumer staples giant earns our Attractive rating because of its positive economic earnings and its low Price to Economic Book Value Ratio of 0.98. At ~$69.95/share, the market price implies PG’s profits (NOPAT) will permanently decline by 2%. Those expectations seem low to me considering PG’s NOPAT has grown 9% compounded annually since 1998. This stock offers good risk/reward.
Figure 2 shows the worst ETF or mutual fund for each sector as of January 23rd, 2013.
Dangerous-or-worse-rated funds have a combination of low-quality portfolios (i.e. they hold too many Dangerous-or-worse rated stocks) and high costs (they charge investors too much for the [lack of] management they provide).
Figure 2: Worst ETF or Mutual Fund In Each Sector
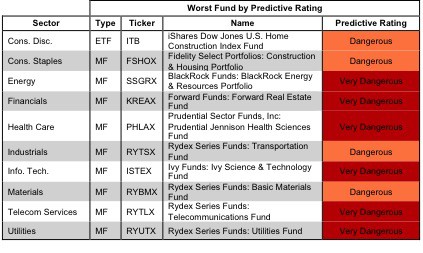 Source: New Constructs, LLC and company filings
REITs are trendy this year; the share price of CBS skyrocketed on January 17 after it announced it was converting its outdoor ad division into a REIT. Still, most of the ETFs and mutual funds in the financials/REIT sector don’t justify the excitement, and Forward Funds: Forward Real Estate Fund (KREAX) is the worst of the bunch. None of the companies it holds earns better than a Neutral rating, and on top of that its Total Annual Costs of 4.19% are sky high.
While XLP has profited from allocating most heavily to a strong company in Procter & Gamble, KREAX suffers due to its top holding, Simon Property Group Inc. (SPG). SPG gets our Very Dangerous rating. To justify the current share price of $161.42, SPG would need to grow NOPAT at 20% compounded annually for nearly 10 years. Those are high expectations for a company that managed only 8% NOPAT growth over the past decade and whose ROIC declined in the last reported fiscal year.
Traditional mutual fund research has focused on past performance and low management costs. The quality of a fund’s holdings has been ignored. Our Portfolio Management Rating examines the fund’s holdings in detail and takes into account the fund’s allocation to cash. Our models are created with data from over 50,000 annual reports. This kind of due diligence is necessary for understanding just what you are buying when you invest in a mutual fund or an ETF.
Figure 3 shows the best ETF or mutual fund based on our Portfolio Management Rating for each sector as of January 23rd, 2013.
Attractive-or-better-rated funds own high-quality stocks and hold very little of the fund’s assets in cash – investors looking to hold cash can do so themselves without paying management fees. Only 6% of funds receive our Attractive or Very Attractive Portfolio Management ratings, so investors need to be cautious when selecting a sector mutual fund or ETF – over 6700 funds earn my Neutral-or-worse-rating.
Figure 3: ETF or Mutual Fund With Highest Quality Holdings by Sector
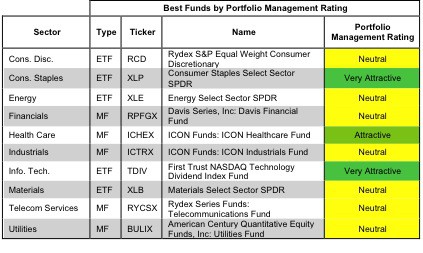 Source: New Constructs, LLC and company filings
Figure 4 shows the worst ETF or mutual fund based on our Portfolio Management Rating for each sector as of January 23rd, 2013.
Many ETFs and mutual funds managers do a poor job identifying quality stocks. These funds are not worth owning at any cost.
Figure 4: ETF or Mutual Fund With Lowest Quality Holdings by Sector
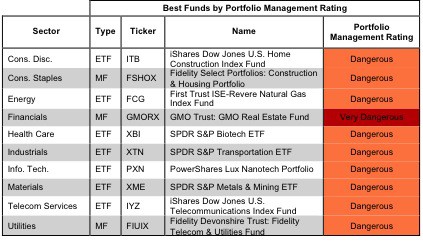 Source: New Constructs, LLC and company filings
Investors should care about all of the fees associated with a fund in addition to the quality of the fund’s holdings. The best ETFs and mutual funds have both low costs and quality holdings – and there are plenty of low cost funds available to investors.
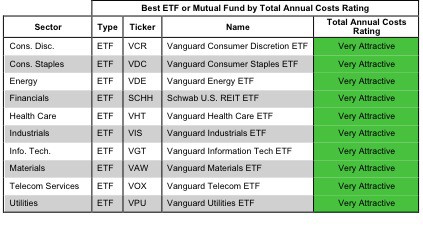
Figure 5 shows the best ETF or mutual fund in each sector according to our Total Annual Costs Rating.
Total Annual Costs incorporates all expenses, loads, fees, and transaction costs into a single value that is comparable across all ETFs and mutual funds. Passively managed ETFs and index mutual funds are generally the cheapest.
Figure 5: ETF or Mutual Fund With Lowest Costs by Sector
 Source: New Constructs, LLC and company filings
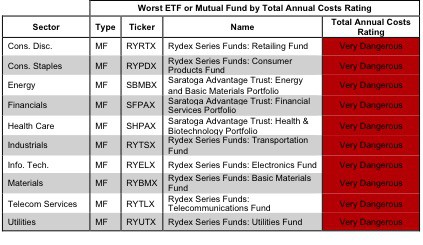
Figures 6 shows the worst fund in each sector according to our Total Annual Costs Rating.
The most expensive fund for each sector has a Very Dangerous Total Annual Costs Rating. Investors should avoid these funds and other funds with Very Dangerous Total Annual Costs Ratings because they charge investors too much. For every fund with a Very Dangerous Total Annual Costs Rating there is an alternative fund that offers similar exposure and holdings at a lower cost. We cover over 7000 mutual funds and over 400 ETFs and the ratings of each can be found at our free ETF & mutual fund screener. Investors have plenty of alternatives to these over priced funds.
Figure 6: ETF or Mutual Fund With Highest Costs by Sector
 Source: New Constructs, LLC and company filings
Sam McBride contributed to this report.
Disclosures: David Trainer and Sam McBride receive no compensation to write about any specific stock, sector or theme.