The Health Care sector ranks second out of the ten sectors as detailed in my Sector Rankings For ETFs and Mutual Funds. It gets my Neutral rating, which is based on aggregation of ratings of 21 ETFs and 92 mutual funds in the Health Care sector as of January 23rd, 2013. Prior reports on the best & worst ETFs and mutual funds in every sector and style are here.
Figures 1 and 2 show the five best and worst-rated ETFs and mutual funds in the sector. Not all Health Care sector ETFs and mutual funds are created the same. The number of holdings varies widely (from 20 to 291), which creates drastically different investment implications and ratings. The best ETFs and mutual funds allocate more value to Attractive-or-better-rated stocks than the worst ETFs and mutual funds, which allocate too much value to Neutral-or-worse-rated stocks.
To identify the best and avoid the worst ETFs and mutual funds within the Health Care sector, investors need a predictive rating based on (1) stocks ratings of the holdings and (2) the all-in expenses of each ETF and mutual fund. Investors need not rely on backward-looking ratings. My fund rating methodology is detailed here.
Investors seeking exposure to the Health Care sector should buy one of the Attractive-or-better rated ETFs or mutual funds from Figures 1.
Get my ratings on all ETFs and mutual funds in this sector on my free mutual fund and ETF screener.
Figure 1: ETFs with the Best & Worst Ratings – Top 5
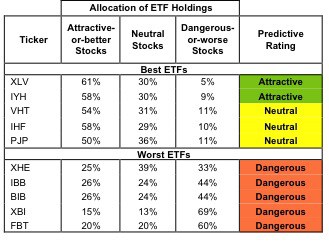 * Best ETFs exclude ETFs with TNAs less than $100 million for inadequate liquidity.
Sources: New Constructs, LLC and company filings
Figure 2: Mutual Funds with the Best & Worst Ratings – Top 5
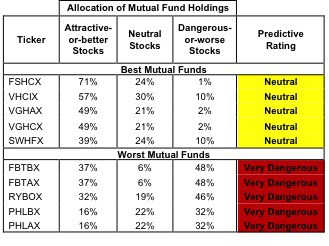 * Best mutual funds exclude funds with TNAs less than $100 million for inadequate liquidity.
Sources: New Constructs, LLC and company filings
Health Care Select Sector SPDR (XLV) is my top-rated Health Care ETF and ICON Funds: ICON Healthcare Fund (ICHCX) is my top-rated Health Care mutual fund. Both earn my Attractive rating.
SPDR S&P Biotech ETF (XBI) is my worst-rated Health Care ETF and Prudential Sector Funds, Inc: Prudential Jennison Health Sciences Fund (PHLAX) is my worst-rated Health Care mutual fund. XBI earns my Dangerous rating and PHLAX earns my Very Dangerous rating.
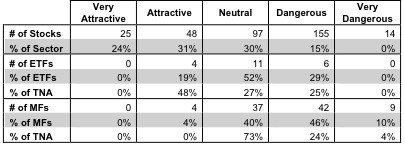
Figure 3 shows that 73 out of the 339 stocks (over 55% of the total net assets) held by Health Care ETFs and mutual funds get an Attractive-or-better rating. However, only four out of 21 Health Care ETFs (less than 48% of total net assets) and 4 out of 92 Health Care mutual funds (less than 1% of total net assets) get an Attractive-or-better rating.
The takeaway: too many mutual fund managers allocate too much capital to low-quality stocks and too many Health Care ETFs hold poor quality stocks.
Figure 3: Health Care Sector Landscape For ETFs, Mutual Funds & Stocks
 Sources: New Constructs, LLC and company filings
Investors need to tread carefully when considering Health Care ETFs and mutual funds. ETF investors appear to be much more sophisticated than mutual fund investors as 48% of Health Care ETF assets are in the Attractive-rated ETFs while 0% of mutual fund assets are the Attractive-rated funds.
As detailed in “Cheap Funds Dupe Investors”, mutual fund investors are good at finding cheap funds but not at finding funds with high quality stocks or with what I call good portfolio management.
Amgen, Inc. (AMGN) is one of my favorite stocks held by Health Care ETFs and mutual funds and earns my Very Attractive rating. AMGN’s growth in after tax cash flows (NOPAT) is impressive: 15% CAGR since 1998. Despite this impressive track record, AMGN’s current price to economic book value ratio is only 0.7, which mean the current valuation of the stock implies AMGN’s NOPAT will permanently decrease by 30%. This disparity between past performance and expectations means excellent risk/reward for investors.
Sarapta Therapeutics (SRPT) is one of my least favorite stocks held by Health Care ETFs and mutual funds and earns my Very Dangerous rating. It currently has negative economic earnings, and a free cash flow yield of -11.1% is not exactly attractive. To justify its share price of ~$24.68, the company must grow revenues by 20% compounded annualy for nearly 20 years while also raising its ROIC from -43% (as of fiscal year 2011) to +50%. Those are high expectations for a company with no recent history of economic profitability.
382 stocks of the 3000+ I cover are classified as Health Care stocks, but Health Care ETFs and mutual funds hold only 339 stocks.
Figures 4 and 5 show the rating landscape of all Health Care ETFs and mutual funds.
Our Sector Rankings For ETFs and Mutual Funds report ranks all sectors and highlights those that offer the best investments.
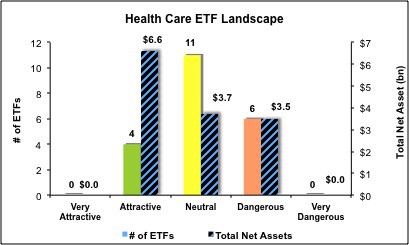
Figure 4: Separating the Best ETFs From the Worst ETFs
 Sources: New Constructs, LLC and company filings
Figure 5: Separating the Best Mutual Funds From the Worst Mutual Funds
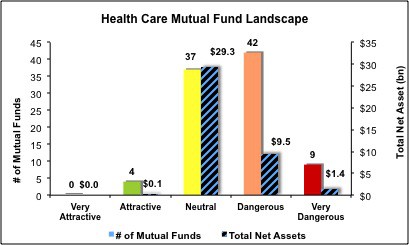 Sources: New Constructs, LLC and company filings
Review my full list of ratings and rankings along with reports on all 21 ETFs and 92 mutual funds in the Health Care sector.
Sam McBride contributed to this report
Disclosure: Neither David Trainer nor Sam McBride receives any compensation to write about any specific stock, sector or theme.