
The Utilities sector ranks ninth out of the ten sectors as detailed in my Sector Rankings for ETFs and Mutual Funds report. It gets my Dangerous rating, which is based on aggregation of ratings of 8 ETFs and 35 mutual funds in the Utilities sector as of January 30, 2013. Prior reports on the best & worst ETFs and mutual funds in every sector and style are here.
Figure 1 ranks from best to worst all eight Utilities ETFs and Figure 2 shows the five best and worst-rated Utilities mutual funds. Not all Utilities sector ETFs and mutual funds are created the same. The number of holdings varies widely (from 22 to 78), which creates drastically different investment implications and ratings. The best ETFs and mutual funds allocate more value to Attractive-or-better-rated stocks than the worst ETFs and mutual funds, which allocate too much value to Neutral-or-worse-rated stocks.
To identify the best and avoid the worst ETFs and mutual funds within the Utilities sector, investors need a predictive rating based on (1) stocks ratings of the holdings and (2) the all-in expenses of each ETF and mutual fund. Investors need not rely on backward-looking ratings. My fund rating methodology is detailed here.
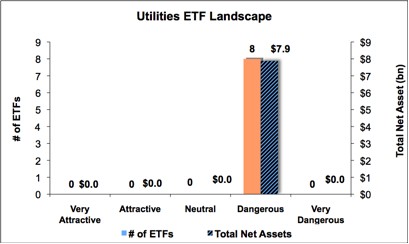
Investors should not buy any Utilities ETFs or mutual funds because none get an Attractive-or-better rating. If you must have exposure to this sector, you should buy a basket of Attractive-or-better rated stocks and avoid paying undeserved fund fees. Active management has a long history of not paying off.
Get my ratings on all ETFs and mutual funds in this sector on my free mutual fund and ETF screener.
Figure 1: ETFs with the Best & Worst Ratings – Top 5
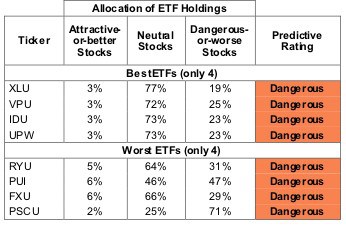 * Best ETFs exclude ETFs with TNAs less than $100 million for inadequate liquidity.
Sources: New Constructs, LLC and company filings
Four ETF’s are excluded from Figure 1 because their total net assets (TNA) are below $100 million and do not meet our liquidity standards
Figure 2: Mutual Funds with the Best & Worst Ratings – Top 5
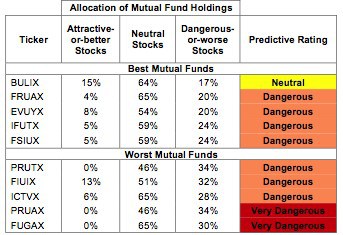 * Best mutual funds exclude funds with TNAs less than $100 million for inadequate liquidity.
Sources: New Constructs, LLC and company filings
Utilities Select Sector SPDR (XLU) is my top-rated Utilities ETF and American Century Quantitative Equity Funds, Inc: Utilities Fund (BULIX) is my top-rated Utilities mutual fund.
PowerShares S&P SmallCap Utilities Portfolio (PSCU) is my worst-rated Utilities ETF and Fidelity Advisor Series VII: Fidelity Advisor Utilities Fund (FUGAX) is my worst-rated Utilities mutual fund.
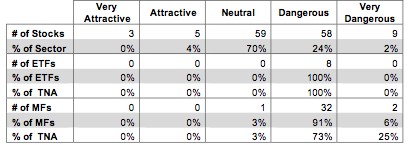
Figure 3 shows that 8 out of the 134 stocks (over 4% of the total net assets) held by Utilities ETFs and mutual funds get an Attractive-or-better rating. However, no Utilities ETFs and no Utilities mutual funds get an Attractive-or-better rating.
The takeaways are: mutual fund managers allocate too much capital to low-quality stocks and Utilities ETFs hold poor quality stocks. Investors are better off picking individual stocks and avoiding the fees that funds charge.
Figure 3: Utilities Sector Landscape For ETFs, Mutual Funds & Stocks
 Sources: New Constructs, LLC and company filings
As detailed in “Cheap Funds Dupe Investors”, the fund industry offers many cheap funds but very few funds with high-quality stocks, or with what I call good portfolio management.
Investors need to tread carefully when considering Utilities ETFs and mutual funds, as no ETFs or mutual funds in the Utilities sector allocate enough value to Attractive-or-better-rated stocks to earn an Attractive rating. Focus on individual stocks instead.
Public Service Electric & Gas Company (PEG) is one of my favorite stocks held by Utilities ETFs and mutual funds and earns my Attractive rating. This company has grown its after-tax cash flow (NOPAT) by 5% compounded annually for the last 13 fiscal years. And yet, the market’s valuation of the stock seems to ignore this fact. At ~$31/share, PEG trades at a 0.6 price to economic book value ratio, which means the market expects PEG’s after-tax profit (NOPAT) to permanently decline by 40%. Such a major decline seems like an overly pessimistic prediction for a company with fairly consistent growth.
California Water Service Group (CWT) is one of my least favorite stocks held by Utilities ETFs and mutual funds and earns my Very Dangerous rating. CWT’s 4% return on invested capital (ROIC) is only half of its weighted average cost of capital (WACC). In other words, CWT must double its ROIC before it creates any shareholder value. I cannot predict when the market will fully recognize CWT’s lack of profitability, but when it does, the sell off in the stock could be severe. The current valuation of CWT (~$19.5/share) implies the company will grow NOPAT at 10% compounded annually for 20 years. Those expectations are awfully high for a utility company. This California company may not ever go bankrupt, but investors who believe in its valuation might.
86 stocks of the 3000+ I cover are classified as Utilities stocks. Due to style drift Utilities ETFs and mutual funds hold 134 stocks.
Figures 4 and 5 show the rating landscape of all Utilities ETFs and mutual funds.
Our Sector Rankings for ETFs and Mutual Funds report ranks all sectors and highlights those that offer the best investments.
Figure 4: Separating the Best ETFs From the Worst ETFs
 Sources: New Constructs, LLC and company filings
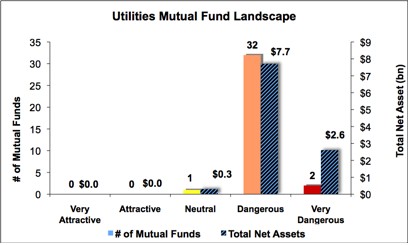
Figure 5: Separating the Best Mutual Funds From the Worst Mutual Funds
 Sources: New Constructs, LLC and company filings
Review my full list of ratings and rankings along with reports on all 8 ETFs and 35 mutual funds in the Utilities sector.
Sam McBride contributed to this report.
Disclosure: David Trainer and Sam McBride receive no compensation to write about any specific stock, sector or theme.