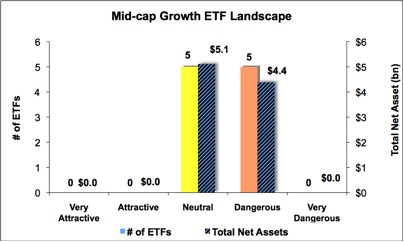
The mid-cap growth style ranks sixth out of the twelve fund styles as detailed in my Style Rankings for ETFs and Mutual Funds report. It gets my Neutral rating, which is based on aggregation of ratings of 10 ETFs and 368 mutual funds in the mid-cap growth style as of February 7th, 2013. Prior reports on the best & worst ETFs and mutual funds in every sector and style are here.
Figure 1 ranks from best to worst the eight mid-cap growth ETFs that meet our liquidity standards and Figure 2 shows the five best and worst-rated mid-cap growth mutual funds. Not all mid-cap growth style ETFs and mutual funds are created the same. The number of holdings varies widely (from 21 to 459), which creates drastically different investment implications and ratings. The best ETFs and mutual funds allocate more value to Attractive-or-better-rated stocks than the worst, which allocate too much value to Neutral-or-worse-rated stocks.
To identify the best and avoid the worst ETFs and mutual funds within the mid-cap growth style, investors need a predictive rating based on (1) stocks ratings of the holdings and (2) the all-in expenses of each ETF and mutual fund. Investors need not rely on backward-looking ratings. My fund rating methodology is detailed here.
Investors should not buy any mid-cap growth ETFs or mutual funds because none get an Attractive-or-better rating. If you must have exposure to this style, you should buy a basket of Attractive-or-better rated stocks and avoid paying undeserved fund fees. Active management has a long history of not paying off.
Get my ratings on all ETFs and mutual funds in this style on my free mutual fund and ETF screener
Figure 1: ETFs with the Best & Worst Ratings – Top 5
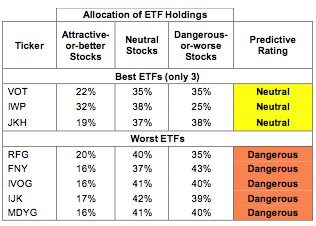 * Best ETFs exclude ETFs with TNAs less than $100 million for inadequate liquidity.
Sources: New Constructs, LLC and company filings
ProShares Ultra Russell MidCap Growth (UKW) is excluded from Figure 1 because its total net assets (TNA) are below $100 million and do not meet our liquidity standards.
Figure 2: Mutual Funds with the Best & Worst Ratings – Top 5
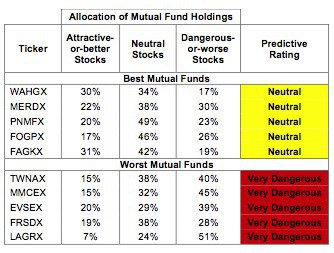 * Best mutual funds exclude funds with TNAs less than $100 million for inadequate liquidity.
Sources: New Constructs, LLC and company filings
Nine mutual funds are excluded from Figure 2 because their total net assets (TNA) are below $100 million and do not meet our liquidity standards.
Vanguard Mid-Cap Growth ETF (VOT) is my top-rated mid-cap growth ETF and Wasatch Funds Trust: Wasatch Heritage Growth Fund (WAHGX) is my top-rated mid-cap growth mutual fund. Both earn my Neutral rating.
SPDR S&P 400 Mid Cap Growth ETF (MDYG) is my worst-rated mid-cap growth ETF and earns my Dangerous rating. Loomis Sayles Funds II: Natixis Loomis Sayles Mid Cap Growth Fund (LAGRX) is my worst-rated mid-cap growth mutual fund and earns my Very Dangerous rating.
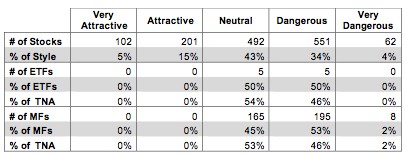
Figure 3 shows that 303 out of the 1408 stocks (over 20% of the market value) in mid-cap growth ETFs and mutual funds get an Attractive-or-better rating. However, none of the 10 mid-cap growth ETFs and none of the 368 mid-cap growth mutual funds get an Attractive-or-better rating. With all those good stocks from which to choose, it is a shame mutual fund managers and ETF providers cannot offer investors better products.
The takeaways are: mutual fund managers allocate too much capital to low-quality stocks and mid-cap growth ETFs hold poor quality stocks. Mutual funds and ETFs in this style do not deserve their fees.
Figure 3: Mid-cap Growth Style Landscape For ETFs, Mutual Funds & Stocks
 Sources: New Constructs, LLC and company filings
As detailed in “Cheap Funds Dupe Investors”, the fund industry offers many cheap funds but very few funds with high-quality stocks, or with what I call good portfolio management.
Investors need to tread carefully when considering mid-cap growth ETFs and mutual funds, as no ETFs or mutual funds in the mid-cap growth style allocate enough value to Attractive-or-better-rated stocks to earn an Attractive rating. Focus on individual stocks instead.
Global Payments, Inc (GPN) is one of my favorite stocks held by mid-cap growth ETFs and mutual funds and earns my Very Attractive rating. GPN has grown its after tax cash flow (NOPAT) by 20% compounded annually for the past 11 years. It has not had a year where NOPAT declined since at least 2001, as far back as our model goes. Despite this fact, GPN is valued at only ~$49.90/share. This share price results in a price to economic book value ratio of 1.0, implying no future growth in NOPAT. This is a company that has grown profits every year this millennium. It seems unlikely that it will never grow NOPAT again.
American Campus Communities, Inc. (ACC) is one of my least favorite stocks held by mid-cap growth ETFs and mutual funds and earns my Very Dangerous rating. ACC has a return on invested capital (ROIC) of only 4%. It would need to double this to cover its 8% weighted average cost of capital (WACC) and start earning positive economic profits. Its valuation is sky high compared to its performance. ACC’s share price of ~$46.70 gives it a price to EBV ratio of 67.0. This valuation implies the company will generate 21% NOPAT growth compounded annually for the next 16 years. Even in a seemingly rebounding real estate market, that level of sustained profit growth is a risky bet.
Figures 4 and 5 show the rating landscape of all mid-cap growth ETFs and mutual funds.
My Style Rankings for ETFs and Mutual Funds report ranks all styles and highlights those that offer the best investments.
Figure 4: Separating the Best ETFs From the Worst Funds
 Sources: New Constructs, LLC and company filings
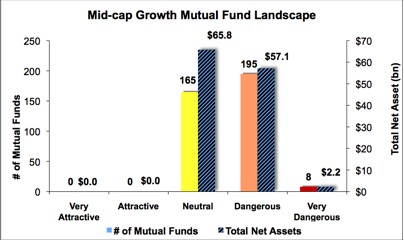
Figure 5: Separating the Best Mutual Funds From the Worst Funds
 Sources: New Constructs, LLC and company filings
Review my full list of ratings and rankings along with reports on all 10 ETFs and 368 mutual funds in the mid-cap growth style.
Sam McBride contributed to this report.
Disclosure: David Trainer and Sam McBride receive no compensation to write about any specific stock, sector or theme.