Check out this week’s Danger Zone interview with Chuck Jaffe of Money Life and MarketWatch.com.
Zale Corporation (ZLC) is in the Danger Zone this week.
Too often investors allow their emotions about a company or stock to cloud their financial judgment. Up 17% year-to-date compared to the S&P 500 (up only 6.5%), the stock is starting to turn a lot of heads. For many investors, “the trend is your friend” when a stock is up so much in a short time.
I am here to warn investors that beauty here is only skin deep. Big red flags hidden in the financial footnotes make this stock much riskier than many investors may realize.
Even on the surface, ZLC is troubling. The income statement for 2012 shows a GAAP net income of -$27 million. Still, this is significantly better than the 2011 net income of -$112 million. With ZLC trading at ~$4.90/share, up 19% year-to-date, investors seem to be buying that this upward trend in accounting earnings will continue.
What investors might not notice, however, are liabilities and red flags hidden in the financial footnotes. Many companies hide negative information in the financial footnotes, and ZLC is not an exception.
The company has $454 million in off-balance sheet debt due to future payments on operating leases. This liability is nearly 60% of reported net assets, and more than twice its market capitalization.
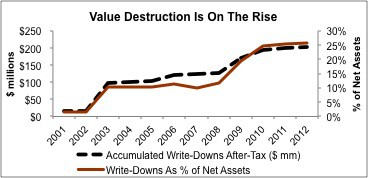
More worrying are the $203 million in accumulated asset write-downs since 2001. At 25% of net assets, these write downs reflect a quarter down the drain for every dollar of investor capital.
Per Figure 1, write-downs have risen steadily since 2001. This trend is not an investor’s friend.
Figure 1: Destroying Shareholder Value Since 2001
 Sources: New Constructs, LLC and company filings
Write-downs, as I have underscored in the past, are a clear sign of management failure.
Even without these red flags in mind, the valuation of ZLC is writing checks the company can not cash. To justify its current share price, ZLC would have to grow after-tax profit (NOPAT) by 4% compounded annually for the next nine years. Such expectations are out of line with historical performance.
ZLC has a -2% NOPAT compounded annual growth rate (CAGR) since 1998 when our model begins. For the past 10 years, its NOPAT CAGR is -5%. This long-term decline in NOPAT, combined with growing asset write-downs and consistently large off balance sheet debt, indicates a company with serious issues.
Accounting data alone is not useful for investors. GAAP net income tells only part of the story for any company. For ZLC, the recent improvement in accounting earnings is hiding some very serious issues hidden in the financial footnotes.
This is a company with off balance sheet debt that is over 60% of its net assets, write-downs that are over 25% of net assets, and after-tax profits that have been declining. Investors should focus on the truth behind the accounting numbers and avoid this stock.
Note there are no ETFs or mutual funds that I cover that allocate significantly to ZLC.
Sam McBride contributed to this post.Disclosure: David Trainer and Sam McBride receive no compensation to write about any specific stock, sector or theme.