Finding the best ETFs is an increasingly difficult task as there are more and more to choose from every day.
You Cannot Trust ETF Labels
There are at least 43 different financial sector ETFs. There are at least 171 ETFs across all sectors. Do investors need 43 different financial sector ETFs or 171 ETFs for 10 sectors? How different can they be?
Those 43 financial sector ETFs are very different. With anywhere from 22 to 505 holdings, many of these ETFs have drastically different holdings, which creates drastically different investment implications.
I am sure that most of them hold the big names in the sector such as Citigroup (C), Bank of America (BAC) and JP Morgan (JPM). However, investors need to know what else those ETFs hold before they can gain a fair understanding of the ETF.
The same is true for the ETFs in any sector as each sector offers a very different mix of good and bad stocks. Some sectors have lots of good stocks and offer lots of good ETFs. The opposite is true for others. And some sectors lie somewhere in between with a fair mix of good and bad stocks. For example, the financial sector, per my 1Q Sector Rankings report, ranks last out of the 10 major sectors when it comes to providing investors with quality ETFs. The consumer staples sector ranks first. The energy and materials sectors are in the middle. Details on the Best & Worst ETFs in each sector are here.
Investors simply cannot trust the ETF labels.
Figure 1: Best Sector ETFs
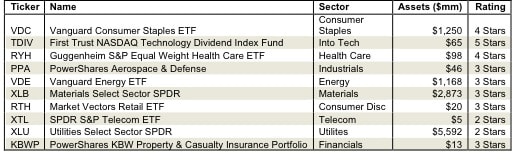 Sources: New Constructs, LLC and company filings
Paralysis By Analysis
The large number of financial (or any other) sector ETFs hurts investors more than it helps because too many options can be paralyzing. It is simply not possible for the majority of investors to properly assess the quality of so many ETFs. Analyzing ETFs, done with the proper diligence, is far more difficult than analyzing stocks because it means analyzing all the stocks within each ETF.That can be as many as 505 stocks for one ETF.
Any investor, worth his salt, knows that knowing the holdings of an ETF is critical to finding the best ETF.
The Danger Within
Why do investors need to know the holdings of ETFs before they buy? They need to know to be sure they do not buy an ETF that might blow up. Buying an ETF without analyzing its holdings is like buying a stock without analyzing its business and finances. As Barron’s says, investors should know the Danger Within. Put another way, research on ETF holdings is necessary due diligence because an ETF’s performance is only as good as its holdings’ performance. No matter how cheap, if it holds bad stocks, the ETF’s performance will be bad.
PERFORMANCE OF ETF’s HOLDINGs = PERFORMANCE OF ETF
Finding the Sector ETFs with the Best Holdings
Figure 1 shows my top rated ETF for each sector. Importantly, my ratings on ETFs are based primarily on my stock ratings of their holdings. My coverage of ETFs leverages the diligence we do on each stock by rating ETFs based on the aggregated ratings of the stocks each ETF holds.
Vanguard Consumer Staples ETF (VDC) is not only the top-rated consumer staples sector ETF, it is the second-highest-rated ETF of the 176 sector ETFs I cover. Most of the top-rated ETFs for a given sector are not very good. For example, APDR S&P Telecom Sector ETF (XTL) is the top-rated telecom sector ETF and it only gets two out of five stars. The same is true for Utilities Select Sector SPDR (XLU).
Worse yet are the ETFs that rank as the best for their sector but have too little liquidity. For example, First Trust NASDAQ Technology Dividend Index Fund (TDIV) is the best tech sector ETF (5-star or Very Attractive ratings) but it only has $65 million in assets. I recommend investors only buy ETFs with more than $100 million in assets. In which case, the next best tech sector ETF is Technology Select Sector SPDR (XLK). Unfortunately, it only gets four stars.
You can find more liquid alternatives for the other funds on my free ETF screener.
Covering All The Bases, Including Costs
My ETF rating also takes into account the total annual costs, which represents the all-in cost of being in the ETF. This analysis is simpler for ETFs than funds because they do not charge front- or back-end loads and transaction costs are incurred directly. There is only the expense ratio, which is normally quite low. However, my ratings penalize those ETFs with abnormally high expense ratios or any other hidden costs.
Top Stocks Make Up Top ETFs
Intel Corporation (INTC) is one of my favorite holdings in TDIV, the only ETF in Figure 1 to get my 5-star rating. This stock gets my Very Attractive raing. INTC has a return on invested capital (ROIC) of 20%, which places it in the top quintile of all companies. Last month it took major steps to expand its chip foundry business, agreeing to manufacture chips on behalf of Altera Corp (ALTR). Manufacturing chips for strategic customers could generate a significant new revenue stream for INTC. The market expectations for INTC, however, are extraordinarily low. Currently trading at ~$21.01/share, INTC has a price to economic book value ratio of 0.6. This ratio means the market expects Intel’s after-tax profit (NOPAT) to permanently decline by 40%. Such a significant decline seems unlikely from a company that has grown NOPAT by 5% compounded annually for the past 14 years. TDIV’s 8% allocation to a highly profitable, yet undervalued stock, exemplifies why TDIV is the only ETF that gets a Very Attractive rating or 5 star rating.
Sam McBride contributed to this report
Disclosure: David Trainer owns ALTR. David Trainer and Sam McBride receive no compensation to write about any specific stock, sector, or theme.