
At the outset of the second quarter of 2013, only a single sector earns an Attractive rating. My sector ratings are based on the aggregation of my fund ratings for every ETF and mutual fund in each sector. More on how New Constructs tackles “big data” in footnotes to deliver proper due diligence in research.
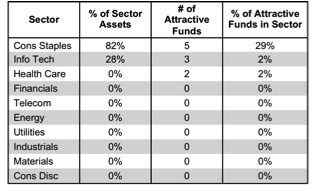
Investors looking for sector funds that hold quality stocks should focus on the Consumer Staples sector. Only this sector has enough Attractive-or-better rated funds to earn my Attractive rating. Figures 6 and 7 provide details. The primary driver behind an Attractive fund rating is good portfolio management, or good stock picking, with low total annual costs
Note that the Attractive-or-better predictive ratings do not always correlate with Attractive-or-better total annual costs. This fact underscores that (1) low fees can dupe investors and (2) investors should invest only in funds with good stocks and low fees.
See Figures 4 through 13 for a detailed breakdown of ratings distributions by sector. See my free ETF & mutual fund screener for rankings, ratings and free reports on 7000+ mutual funds and 400+ ETFs. My fund rating methodology is detailed here.
Reports on the best & worst ETFs and mutual funds in every sector and investment style are here.
Figure 1: Ratings For All Sectors
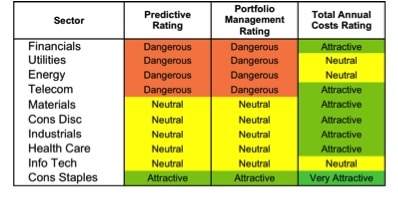
Source: New Constructs, LLC and company filings
To earn an Attractive-or-better Predictive Rating, an ETF or mutual fund must have high-quality holdings and low costs. Only 10 sector ETFs and mutual funds meet these requirements, which is only 6% of all sector ETFs and mutual funds.
Consumer Staples Select Sector SPDR (XLP) is my top Consumer Staples ETF. It gets my Attractive rating by allocating over 67% of its value to Attractive-or-better-rated stocks.
Wal-Mart Stores, Inc. (WMT) is one of my favorite stocks held by XLP and earns my Attractive rating. WMT is one of the most consistent companies we cover. The business has, grown after tax profit (NOPAT) by 11% compounded annually for the past 15 years. NOPAT increased every single year during that time. Such consistency typically commands a high valuation, but the market has curiously low expectations for WMT. Trading at ~$78.12/share, the stock has a price to economic book value ratio of 0.8, meaning the market is expecting WMT’s NOPAT to permanently decline by 20%. For a company with a proven track record of growth, such pessimistic expectations seem unwarranted. WMT’s low valuation, combined with its impressive historical performance, offers investors a high potential reward with very little risk.
Rydex Series Funds: Real Estate Fund (RYREX) is my worst rated Financials mutual fund. It gets my Very Dangerous rating by allocating over 88% of its value to Neutral-or-worse-rated stocks, and to make matters worse, charges investors total annual costs of 8.36%.
Ventas Inc. (VTR) is one of my least favorite stocks held by RYREX and gets my Very Dangerous rating. VTR has benefited from the rapidly aging US population as over 50% of its business is providing senior housing facilities. However, its business model is now under pressure from increasing competition in the industry, as small new firms are jumping into the market and driving down margins and returns on invested capital (ROIC). VTR has seen its ROIC decline from 177% in 2003 down to 3.5% in 2012. Declining ROIC has lead to VTR making negative economic earnings for the past two years. The market, though, is focusing on the demographic changes and rising GAAP net income to project very high expectations onto VTR. The company’s current share price of ~$75.53 implies 20% growth in NOPAT over 16 years. Betting on that kind of growth, for any company, is a risky proposition. For more analysis on VTR see “Danger Zone 3/18/2013: Ventas Inc. (VTR)”.
Figure 2 shows the distribution of our Predictive Ratings for all sector ETFs and mutual funds.
Figure 2: Distribution of ETFs & Mutual Funds (Assets and Count) by Predictive Rating
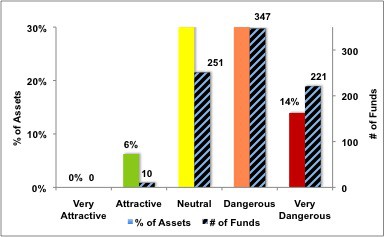
Source: New Constructs, LLC and company filings
Figure 3 offers additional details on the quality of the sector funds. Note that the average Total Annual Cost of Very Dangerous funds is almost 10 times that of Attractive funds.
Figure 3: Predictive Rating Distribution Stats
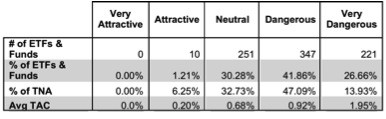
* Avg TAC = Weighted Average Total Annual Costs
Source: New Constructs, LLC and company filings
Ratings by Sector
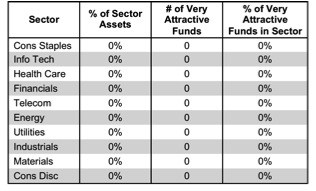
Figure 4 presents a mapping of Very Attractive funds by sector. The chart shows the number of Very Attractive funds in each sector and the percentage of assets in each sector allocated to funds that are rated Very Attractive.
No sector ETFs or mutual funds earn my Very Attractive rating. This is unusual. Normally, at least one or two sector funds allocate sufficiently to Attractive and Very Attractive stocks to earn my highest rating.
Figure 4: Very Attractive ETFs & Mutual Funds by Sector
Source: New Constructs, LLC and company filings
Figure 5 presents the data charted in Figure 4
Figure 5: Very Attractive ETFs & Mutual Funds by Sector
Source: New Constructs, LLC and company filings
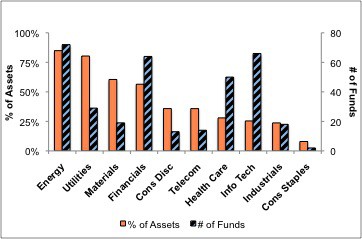
Figure 6 presents a mapping of Attractive funds by sector. The chart shows the number of Attractive funds in each sector and the percentage of assets allocated to Attractive-rated funds in each sector.
Note that the Consumer Staples, Information Technology, and Health Care sectors are the only sectors that house Attractive-rated funds. The Consumer Staples sector is the only one to have more than 50% of its assets allocated to Attractive rated funds.
The extremely small allocation by investors to Attractive funds in the Health Care sector is troubling. It suggests that investors are struggling to find the high quality funds in that sector.
Figure 6: Attractive ETFs & Mutual Funds by Sector
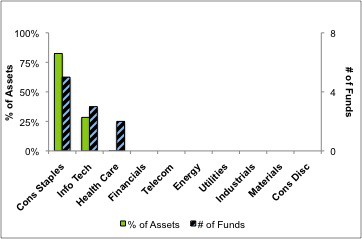
Source: New Constructs, LLC and company filings
Figure 7 presents the data charted in Figure 6.
Figure 7: Attractive ETFs & Mutual Funds by Sector
Source: New Constructs, LLC and company filings
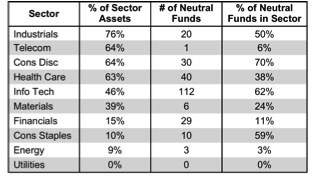
Figure 8 presents a mapping of Neutral funds by sector. The chart shows the number of Neutral funds in each sector and the percentage of assets allocated to Neutral-rated funds in each sector.
Figure 8: Neutral ETFs & Mutual Funds by Sector
Source: New Constructs, LLC and company filings
Figure 9 presents the data charted in Figure 8.
Figure 9: Neutral ETFs & Mutual Funds by Sector
Source: New Constructs, LLC and company filings
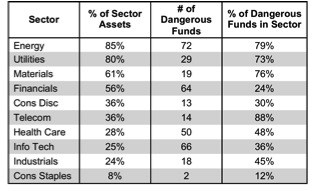
Figure 10 presents a mapping of Dangerous funds by fund sector. The chart shows the number of Dangerous funds in each sector and the percentage of assets allocated to Dangerous-rated funds in each sector.
The landscape of sector ETFs and mutual funds is littered with Dangerous funds. Investors in Energy and Utilities funds have over 75% of their assets invested in Dangerous-rated funds.
Figure 10: Dangerous ETFs & Mutual Funds by Sector
Source: New Constructs, LLC and company filings
Figure 11 presents the data charted in Figure 10.
Figure 11: Dangerous ETFs & Mutual Funds by Sector
Source: New Constructs, LLC and company filings
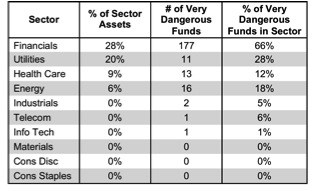
Figure 12 presents a mapping of Very Dangerous funds by fund sector. The chart shows the number of Very Dangerous funds in each sector and the percentage of assets in each sector allocated to funds that are rated Very Dangerous.
The fact that there are 177 Very Dangerous funds in the Financials sector is troubling. Investors have to look very hard to find the quality funds in the midst of all the poor ones.
Figure 12: Very Dangerous ETFs & Mutual Funds by Sector
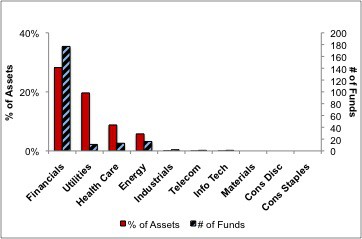
Source: New Constructs, LLC and company filings
Figure 13 presents the data charted in Figure 12.
Figure 13: Very Dangerous ETFs & Mutual Funds by Sector
Source: New Constructs, LLC and company filings
Sam McBride contributed to this report.
Disclosure: David Trainer owns WMT. David Trainer and Sam McBride receive no compensation to write about any specific stock, sector, or theme.