
The Large-cap Value style ranks second out of the twelve fund styles as detailed in my Style Rankings for ETFs and Mutual Funds report. It gets my Neutral rating, which is based on aggregation of ratings of 41 ETFs and 772 mutual funds in the Large-cap Value style as of May 1, 2013. Prior reports on the best & worst ETFs and mutual funds in every sector and style are here.
Figures 1 and 2 show the five best and worst-rated ETFs and mutual funds in the style. Not all Large-cap Value style ETFs and mutual funds are created the same. The number of holdings varies widely (from 20 to 1,412), which creates drastically different investment implications and ratings. The best ETFs and mutual funds allocate more value to Attractive-or-better-rated stocks than the worst, which allocate too much value to Neutral-or-worse-rated stocks.
To identify the best and avoid the worst ETFs and mutual funds within the Large-cap Value style, investors need a predictive rating based on (1) stocks ratings of the holdings and (2) the all-in expenses of each ETF and mutual fund. Investors need not rely on backward-looking ratings.
My fund rating methodology is detailed here.
Investors seeking exposure to the Large-cap Value style should buy one of the Attractive-or-better rated ETFs or mutual funds from Figures 1 and 2.
Get my ratings on all ETFs and mutual funds in this style on my free mutual fund and ETF screener.
Figure 1: ETFs with the Best & Worst Ratings – Top 5
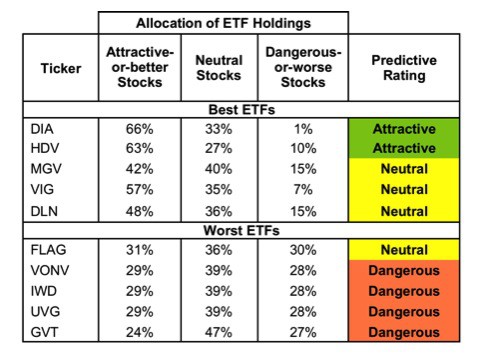 * Best ETFs exclude ETFs with TNAs less than $100 million for inadequate liquidity.
Sources: New Constructs, LLC and company filings
Four tickers are excluded from Figure 1 because their total net assets (TNA) are below $100 million and do not meet our liquidity standards.
Figure 2: Mutual Funds with the Best & Worst Ratings – Top 5
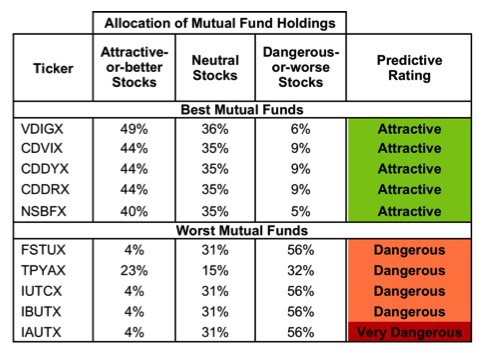 * Best mutual funds exclude funds with TNAs less than $100 million for inadequate liquidity.
Sources: New Constructs, LLC and company filings
Dow Jones Industrial Average ETF (DIA) is my top-rated Large-cap Value ETF and Vanguard Specialized Funds: Vanguard Dividend Growth Fund (VDIGX) is my top-rated Large-cap Value mutual fund. Both earn my Attractive rating.
Columbia Concentrated Large Cap Value Strategy Fund (GVT) is my worst-rated Large-cap Value ETF and AIM Sector Funds: Invesco Dividend Income Fund (IAUTX) is my worst-rated Large-cap Value mutual fund. GVT earns my Dangerous rating and IAUTX earns my Very Dangerous rating.
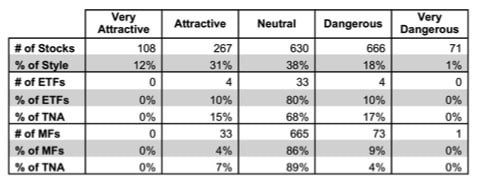
Figure 3 shows that 375 out of the 1,742 stocks (over 43% of the market value) in Large-cap Value ETFs and mutual funds get an Attractive-or-better rating. However, only 4 out of 41 Large-cap Value ETFs (less than 15% of total net assets) and 33 out of 772 Large-cap Value mutual funds (less than 7% of total net assets) get an Attractive-or-better rating.
For both ETFs and mutual funds, the percentage of total net assets in Attractive rated funds is greater than the percentage of funds that earn an Attractive rating. This allocation choice is encouraging as it suggests that investors are, to a small extent, correctly identifying the funds with the best portfolio management. However, the low number of Attractive ETFs and mutual funds is concerning given the number of Attractive-or-better rated stocks available for fund managers to choose from.
The takeaways are: mutual fund managers allocate too much capital to low-quality stocks and Large-cap Value ETFs hold poor quality stocks.
Figure 3: Large-cap Value Style Landscape For ETFs, Mutual Funds & Stocks
 Sources: New Constructs, LLC and company filings
As detailed in “Cheap Funds Dupe Investors”, the fund industry offers many cheap funds but very few funds with high-quality stocks, or with what I call good portfolio management.
Investors need to tread carefully when considering Large-cap Value ETFs and mutual funds, as the number of Dangerous-or-worse rated ETFs and mutual funds exceeds the amount of Attractive-or-better rated funds.
Stryker Corporation (SYK) is one of my favorite stocks held by Large-cap Value ETFs and mutual funds and earns my Very Attractive rating. This medical equipment company has an impressive track record of growth as after tax profits (NOPAT) have grown by 21% compounded annually for the past 14 years. Its return on invested capital (ROIC) has been consistently over 20% for the past decade. SYK’s $4.1 billion in excess cash is more than enough to cover its current liabilities, freeing up future cash flows to create value for investors. Given these strong fundamentals, as well as the potential for growth in the health care industry, one would expect SYK to be priced for significant growth. Instead, at its current valuation of ~$65.58/share, SYK has a price to economic book value ratio of 1.0, implying no future growth in NOPAT. If SYK continues to grow NOPAT the way it has in the past, it will reward investors.
Bank of America Corp (BAC) is one of my least favorite stocks held by Large-cap Value ETFs and mutual funds and earns my Dangerous rating. BAC has a bottom-quintile ROIC of just 0.4%, well below the level of return required (WACC) for the company to make positive economic earnings. To make matters worse, BAC has significant liabilities that have a senior claim cash flows compared to equity investors. BAC’s $14 billion in off-balance sheet debt due to operating leases is more than 10 times its 2012 NOPAT. Also troubling for the average investor is the $18.8 billion in preferred capital in BAC.
BAC’s low NOPAT and major liabilities reveal a business with very weak fundamentals. However, the market’s valuation of BAC seems to ignore the company’s fundamentals. At ~$12.31/share, BAC’s valuation implies the company will grow NOPAT by 21% compounded annually for 20 years. Such high expectations suggest BAC is priced for perfection. Investing in any company with that level of growth priced into the stock would be risky, especially for a company with the spotty track record of BAC.
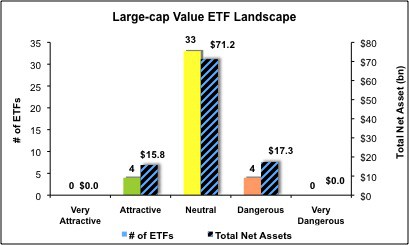
Figures 4 and 5 show the rating landscape of all Large-cap Value ETFs and mutual funds.
My Style Rankings for ETFs and Mutual Funds report ranks all styles and highlights those that offer the best investments.
Figure 4: Separating the Best ETFs From the Worst Funds
Sources: New Constructs, LLC and company filings
Figure 5: Separating the Best Mutual Funds From the Worst Funds
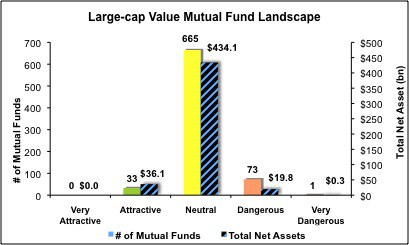
Sources: New Constructs, LLC and company filings
Review my full list of ratings and rankings along with reports on all 41 ETFs and 772 mutual funds in the Large-cap Value style.
Sam McBride contributed to this report
Disclosure: David Trainer and Sam McBride receive no compensation to write about any specific stock, sector, or theme.