The Small-cap Blend style ranks eleventh out of the twelve fund styles as detailed in my Style Rankings for ETFs and Mutual Funds report. It gets my Dangerous rating, which is based on aggregation of ratings of 22 ETFs and 643 mutual funds in the Small-cap Blend style as of May 3, 2013. Prior reports on the best & worst ETFs and mutual funds in every sector and style are here.
Figures 1 and 2 show the five best and worst-rated ETFs and mutual funds in the style. Not all Small-cap Blend style ETFs and mutual funds are created the same. The number of holdings varies widely (from 12 to 2,288), which creates drastically different investment implications and ratings. The best ETFs and mutual funds allocate more value to Attractive-or-better-rated stocks than the worst, which allocate too much value to Neutral-or-worse-rated stocks.
To identify the best and avoid the worst ETFs and mutual funds within the Small-cap Blend style, investors need a predictive rating based on (1) stocks ratings of the holdings and (2) the all-in expenses of each ETF and mutual fund. Investors need not rely on backward-looking ratings.
My fund rating methodology is detailed here.
Investors should not buy any Small-cap Blend ETFs or mutual funds because none get an Attractive-or-better rating. If you must have exposure to this style, you should buy a basket of Attractive-or-better rated stocks and avoid paying undeserved fund fees. Active management has a long history of not paying off.
Get my ratings on all ETFs and mutual funds in this style on my free mutual fund and ETF screener.
Figure 1: ETFs with the Best & Worst Ratings – Top 5
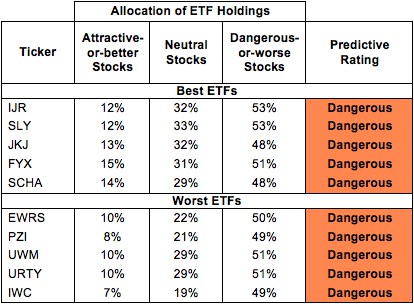 * Best ETFs exclude ETFs with TNAs less than $100 million for inadequate liquidity.
Sources: New Constructs, LLC and company filings
PowerShares RAFI Fundamental Pure Small Core Portfolio (PXSC), Vanguard S&P 600 Small Cap ETF (SLY) and ProShares Ultra SmallCap 600 (SAA) are excluded from Figure 1 because their total net assets (TNA) are below $100 million and do not meet our liquidity standards.
Figure 2: Mutual Funds with the Best & Worst Ratings – Top 5
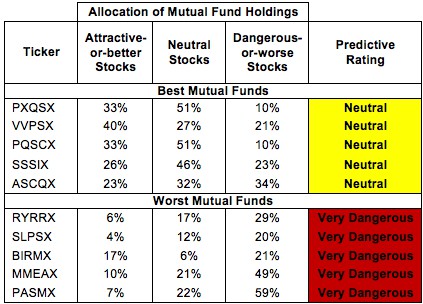 * Best mutual funds exclude funds with TNAs less than $100 million for inadequate liquidity.
Sources: New Constructs, LLC and company filings
Six mutual funds are excluded from Figure 2 because their total net assets (TNA) are below $100 million and do not meet our liquidity standards.
iShares Core S&P Small-Cap ETF (IJR) is my top-rated Small-cap Blend ETF and Virtus Quality Small-cap Fund (PXQSX) is my top-rated Small-cap Blend mutual fund. IJR earns my Dangerous rating and PXQSX earns my Neutral rating
iShares Russell Microcap Index Fund (IWC) is my worst-rated Small-cap Blend ETF and Pacific Advisors Fund Inc: Small Cap Value Fund (PASMX) is my worst-rated Small-cap Blend mutual fund. IWC earns my Dangerous rating and PASMX earns my Very Dangerous rating.
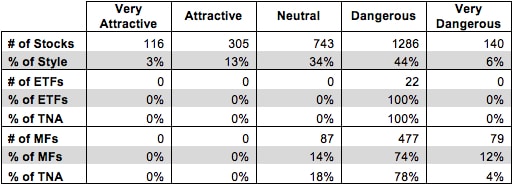
Figure 3 shows that 421 out of the 2,590 stocks (over 16% of the market value) in Small-cap Blend ETFs and mutual funds get an Attractive-or-better rating. However, no ETFs or mutual funds in the Small-cap Blend style earn an Attractive rating.
I am astonished that with so many good stocks to choose from ETF providers and mutual fund managers are not putting together more attractive portfolios for investors.
Figure 3: Small-cap Blend Style Landscape For ETFs, Mutual Funds & Stocks
 Sources: New Constructs, LLC and company filings
As detailed in “Cheap Funds Dupe Investors”, the fund industry offers many cheap funds but very few funds with high-quality stocks, or with what I call good portfolio management.
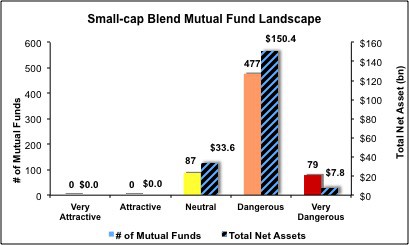
Investors need to tread carefully when considering Small-cap Blend ETFs and mutual funds, as all 22 ETFs and 556 out of 643 Small-cap Blend mutual funds earn a Dangerous-or-worse rating. There are no Attractive ETFs or mutual funds in the style, so investors should focus on individual stocks instead.
Teradyne Inc. (TER) is one of my favorite stocks held by Small-cap Blend ETFs and mutual funds and earns my Very Attractive rating. TER’s 15% return on invested capital (ROIC) is in the top quintile of all 3000 companies I cover. TER is ideally situated to take advantage of the rapid pace of innovation in our economy. As a developer of automatic test equipment with customers like Samsung, IBM (IBM), and Texas Instruments (TXN), TER is in the enviable position of being able to profit off of innovation without having the pressure to innovate itself. TER’s $400 million free cash flow last year and $1 billion in excess cash give it the resources to fuel future growth.
Despite these strong fundamentals, TER is priced for permanent profit decline. At its current valuation of ~$16.15, TER has a price to economic book value ratio of 0.9, implying a permanent 10% decline in after tax profit (NOPAT). With such high ROICs, a healthy balance sheet, and an appealing position in the market, I think Teradyne will exceed the pessimistic expectations baked into its stock’s valuation.
Sanmina Corp (SANM) is one of my least favorite stocks held by Small-cap Blend ETFs and mutual funds and earns my Very Dangerous rating. SANM last earned positive economic earnings in 1998. Its NOPAT declined by 35% between 2010 and 2012. The main source of SANM’s struggles is poor capital allocation. SANM has over $4.2 billion in accumulated asset write-downs, 200% or twice its reported net assets. Asset write-downs are a sign of management failure. When the amount of value that management has destroyed is so high, something is seriously wrong.
The market appears to be ignoring the very shaky fundamentals of SANM and is projecting considerable growth for the company. To justify its current valuation of ~$12.44/share, SANM would need to grow NOPAT by 10% compounded annually for six years. For a company with declining NOPAT, no recent track record of economic profitability, and an ROIC under 2%, betting on that level of growth is too risky.
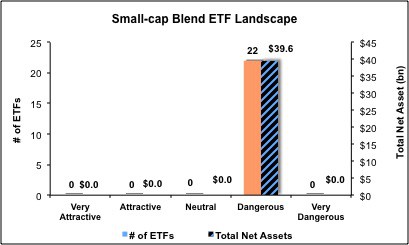
Figures 4 and 5 show the rating landscape of all Small-cap Blend ETFs and mutual funds.
My Style Rankings for ETFs and Mutual Funds report ranks all styles and highlights those that offer the best investments.
Figure 4: Separating the Best ETFs From the Worst Funds
 Sources: New Constructs, LLC and company filings
Figure 5: Separating the Best Mutual Funds From the Worst Funds
 Sources: New Constructs, LLC and company filings
Review my full list of ratings and rankings along with reports on all 22 ETFs and 643 mutual funds in the Small-cap Blend style.
Sam McBride contributed to this report.
Disclosure: David Trainer and Sam McBride receive no compensation to write about any specific stock, sector, style or theme.