
One of the major selling points of index ETFs is that they remove the need to pick stocks. By tracking indexes, these ETFs, in theory, serve investors by providing targeted exposure to the market as a whole, specific sectors or other benchmarks. The problem is that the word “index” in an ETF label does not always mean that investors are getting the specific exposure they seek. Diligence on ETF holdings is necessary despite what the providers might have you believe. Below I dispel the following myths concerning index ETFs.
Myth 1: Index ETFs Hold the Same Stocks
One would expect two index ETFs with the same stated purpose to allocate to roughly similar stocks.
This is not the case. iShares Dow Jones Select Dividend Index Fund (DVY) and First Trust Morningstar Dividend Leaders Index Fund (FDL) are both Large Cap Value funds that track stocks with the highest dividend yields. One would expect the two to have largely the same holdings, but, in fact, the two have no stocks in common in their top 10 holdings. How can that be?
Myth 2: Indexes Are Based On Pre-Defined/Standardized Lists
The rapid growth in ETFs and indexes does a disservice to investors by creating noise and confusion. Of the nearly 400 ETFs that I cover, 89 have the word “index” in in the title, and almost all of these 89 ETFs track a different index. There are multiple indexes for almost any segment of the market: multiple dividend indexes, multiple real estate indexes, even multiple indexes for the socially conscious investor.
Indexes are not some perfectly objective snapshot of a given benchmark. An index, like any portfolio, is created by people. There may be a calculation or set of parameters that picks the stocks in these indexes, but a person is still defining these parameters. Unless the index is extremely broad, it will likely over or underperform its benchmark based on the difference in the stocks it holds. This brings us to another myth:
Myth 3: The Label/Name Tells You What Stocks Are In An ETF
A label can give you a clue to the holdings of an ETF. For instance, most investors could predict that iShares Dow Jones U.S. Broker-Dealers Index Fund (IAI) allocates significantly to Goldman Sachs (GS), Morgan Stanley (MS) and Charles Schwab (SCHW). However, I doubt many investors could guess that the top holding in IAI is Knight Capital Group (KCG), which currently trades at ~$3.70/share and has a market cap of only $1.4 billion.
Even when an ETF offers no surprises in the types of companies it holds, the weighting of these holdings can meaningfully affect performance. For example, iShares Goldman Sachs Technology Index Fund (IGM), which is up 13.6% YTD, has meaningfully out performed iShares Dow Jones U.S. Technology Index Fund (IYW), which is up +8.6% YTD because it allocated a lot less of its portfolio to Apple (AAPL): 8.4% allocation to AAPL for IGM compared to 16.5% for IYW.
Heavier allocation to the underperforming AAPL causes IYW to meaningfully underperform IGM.
The examples of unexpected stocks in index ETFs are too many to count. How many of you would guess that the largest holding of First Trust ISE Cloud Computing Index Fund (SKYY) would be Netflix (NFLX)? The streaming video provider is a massive user of cloud computing services, but I think the average investor would have expected a cloud provider like Amazon (AMZN) or Salesforce.com (CRM) to occupy that top spot.
Buying an ETF based on its index label is like flying blind. Buying an ETF without understanding its holdings is like buying a stock without understandings its fundamentals and business model. However, investors think they can get away with it due to the fourth myth of index ETFs:
Myth 4: The Past Performance of an Index Predicts Its Future Performance
A recent study by Vanguard found that the back-test results used in marketing ETFs are not reliable. Specifically, the average back-tested index outperformed the market by 10.3% per year in the five years before an ETF’s launch, then underperformed by 1% a year in the first five years of the ETF’s existence. That’s an 11% swing from outperformance to underperformance. Investors need to remember that providers make money by selling ETFs not making investors rich. Accordingly, providers are good at marketing.
This problem is most severe with the newest ETFs. Many providers handcraft an index to show the best results in the past while ignoring the potential future performance. The same issue applies to long established ETFs as what has worked in the past is not guaranteed to work in the future. For example, look at the performance of ETFs and mutual funds that were heavily allocated to AAPL and gold in 2012 versus this year. The previously mentioned IYW had a return of 27% from September 14, 2011 to September 14, 2012, driven by the strong performance of AAPL. However, the decline in AAPL’s share price since that point has held IYW back, leading to its -2% return from Sept. 14 to today, even as the rest of the tech sector has surged.
Buying an ETF based solely on past performance assumes that the conditions that led to good past performance will continue in perpetuity, a practical impossibility.
My predictive ratings of ETFs and mutual funds do not rely past performance.
Only Holdings Can Drive Performance
First Trust NASDAQ Technology Dividend Index Fund (TDIV) is one of my top-rated Information Technology ETFs and earns my Attractive rating. Its top four holdings all earn my Very Attractive rating. Cisco Systems (CSCO) is one of these four stocks, and one of my favorite holdings in TDIV. As I’ve previously written, investors should not be fooled into thinking that the rapid growth in CSCO’s valuation two weeks ago means it’s now overvalued. At its current price of ~$23.53/share, CSCO has a price to economic book value ratio of 0.8, implying a permanent 20% decline in its after tax profit (NOPAT). Given that CSCO has grown NOPAT by 26% compounded annually over the past decade, such a drastic decline seems unlikely. CSCO’s valuation looks set to continue rising and will bring TDIV up with it.
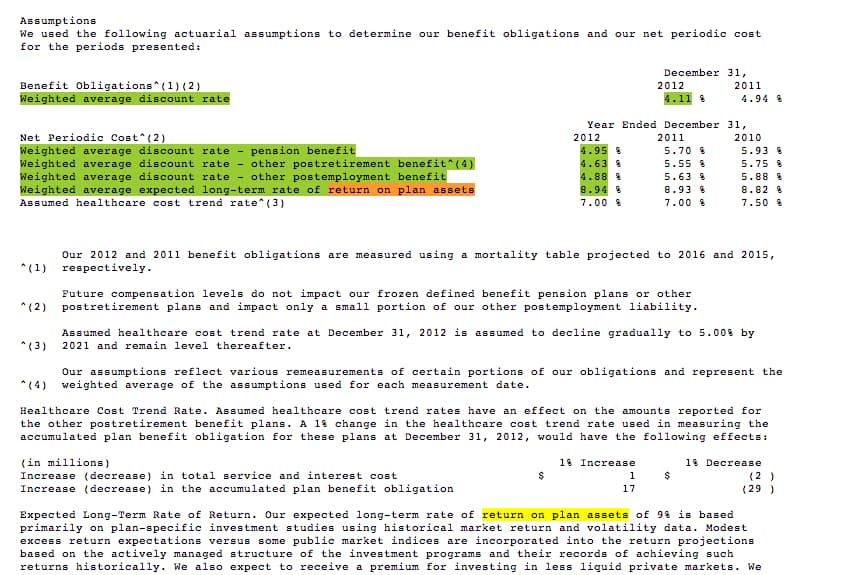
ALPS ALPS/GS Risk-Adjusted Return U.S. Large Cap Index ETF (GSRA) is one of my least favorite Large Cap Blend ETFs and earns my Dangerous rating. Delta Airlines (DAL) is one of my least favorite stocks held by GSRA and earns my Dangerous rating. I wrote last year that DAL’s underfunded pensions put the stock at risk. DAL’s unusually high assumptions for return on plan assets (8.93%) allowed it to leave its pension plan underfunded by $14.1 billion. This year, the situation is worse. DAL boosted its expected return on plan assets another 0.01 to 8.94% and the gap between plan assets and projected obligations grew to $15.9 billion.
The airline business is not a cash cow, as DAL’s consistently negative economic earnings show. It’s hard to see where the cash to fund DAL’s pensions will come from if its actual returns do not meet the high returns expected on which the company’s earnings are based. Meanwhile, in order to justify its current valuation of ~$18.93/share, DAL needs to grow its NOPAT by 6% compounded annually for 15 years. Given DAL’s balance sheet issues, and its poor recent profit track record, those expectations seem awfully high. Investors in DAL, which includes investors in GSRA, are taking on a great deal of risk with very little in the way of reward.
Sam McBride contributed to this report
Disclosure: David Trainer owns CSCO. David Trainer and Sam McBride receive no compensation to write about any specific stock, sector, or theme.
Photo: Travelbusy.com (Flickr)