Finding the best ETFs is an increasingly difficult task in a world with so many to choose from.
You Cannot Trust ETF Labels
There are at least 27 different Information Technology ETFs and at least 173 ETFs across all sectors. Do investors need that many choices? How different can the ETFs be?
Those 27 Information Technology ETFs are very different. With anywhere from 25 to 417 holdings, many of these Information Technology ETFs have drastically different portfolios, creating drastically different investment implications.
The same is true for the ETFs in any other sector, as each offers a very different mix of good and bad stocks. Some sectors have lots of good stocks and offer quality ETFs. The opposite is true for some sectors, while others lie in between these extremes with a fair mix of good and bad stocks. For example, the Materials sector, per my 3Q Sector Rankings Report, ranks sixth out of 10 sectors when it comes to providing investors with quality ETFs. Consumer Staples ranks first. Financials ranks last. Details on the Best & Worst ETFs in each sector are here.
The bottom line is: ETF labels do not tell you the kind of stocks you are getting in any given ETF.
Figure 1: Best Sector ETFs
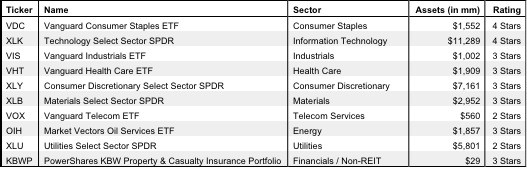
Source: New Constructs, LLC and company filings
Paralysis By Analysis
I firmly believe ETFs for a given sector should not all be that different. I think the large number of Health Care (or any other) sector of ETFs hurts investors more than it helps because too many options can be paralyzing. It is simply not possible for the majority of investors to properly assess the quality of so many ETFs. Analyzing ETFs, done with the proper diligence, is far more difficult than analyzing stocks because it means analyzing all the stocks within each ETF. As stated above, that can be as many as 417 stocks, and sometimes even more, for one ETF.
Any investor worth his salt recognizes that analyzing the holdings of an ETF is critical to finding the best ETF.
The Danger Within
Why do investors need to know the holdings of ETFs before they buy? They need to know to be sure they do not buy an ETF that might blow up. Buying an ETF without analyzing its holdings is like buying a stock without analyzing its business and finances. As Barron’s says, investors should know the Danger Within. No matter how cheap, if it holds bad stocks, the ETF’s performance will be bad.
PERFORMANCE OF ETF’S HOLDINGS = PERFORMANCE OF ETF
Finding the Sector ETFS with the Best Holdings
Figure 1 shows my top rated ETF for each sector. Importantly, my ratings on ETFS are based primarily on my stock ratings of their holdings. My firm covers over 3000 stocks and is known for the due diligence we do for each stock we cover. Accordingly, our coverage of ETFS leverages the diligence we do on each stock by rating ETFS based on the aggregated ratings of the stocks each ETF holds.
Vanguard Consumer Staples ETF (VDC) is the top-rated Consumer Staples ETF and the overall top-rated ETF of the 173 sector ETFS I cover. Only the Consumer Staples and Information Technology sectors contain any Attractive (i.e. 4-star) rated ETFs, while the best every other sector can offer is a Neutral or 3-star ETF, or even a Dangerous or 2-star ETF.
Sometimes, you get what you pay for
It is troubling to see one of the best sector ETFs, First Trust Nasdaq Technology Dividend Index Fund (TDIV), have just $172 million in assets despite being one of only five sector ETFs to earn a 4-star rating. On the other hand, Neutral-rated Vanguard Information Technology ETF (VGT) has nearly $3.3 billion in assets. VGT has lower total annual costs than TDIV (0.15% and 0.55% respectively), but low costs cannot drive positive performance. Quality holdings are the ultimate driver of performance.
I cannot help but wonder if investors would leave VGT if they knew that it has such a mediocre portfolio of stocks. It is cheaper than TDIV, but as previously stated, low fees cannot growth wealth; only good stocks can.
Sometimes, you DON’T get what you pay for
First Trust NYSE Arca Biotechnology Index Fund (FBT) is my worst-rated Health Care ETF. FBT allocates over 60% of its assets to Dangerous-or-worse stocks and charges total annual costs of 0.66%. On the other hand, Market Vectors Biotech ETF (BBH) has very similar holdings (including three of the same top five) with total annual costs of only 0.39%.
One would expect BBH to have more assets, but FBT actually has $676 million, nearly double the $356 million in BBH. It seems investors are willing to pay nearly double the fees in FBT to get very similar exposure to what they could get from BBH.
The worst ETF in Figure 1 is Utilities Select Sector SPDR (XLU), which gets a Dangerous (2-Star) rating. One would think ETF providers could do better for this sector. PowerShares KBW Property & Casualty Insurance Portfolio (KBWP) is the only ETF in Figure 1 with less than $100 million in assets, my minimum level to ensure adequate liquidity. You can find more liquid alternatives for ETFs on my free ETF screener.
Covering All The Bases, Including Costs
My ETF rating also takes into account the total annual costs, which represents the all-in cost of being in the ETF. This analysis is complex for mutual funds, but straightforward for ETFs, where all costs are factored into the expense ratio. While costs play a smaller role than holdings, my ratings penalize those ETFs with abnormally high costs.
Top Stocks Make Up Top ETFS
Wal-Mart (WMT) is one of my favorite stocks held by VDC and earns my Attractive rating. WMT has grown after-tax profit (NOPAT) every single year since 1998 and 11% compounded annually over that time frame. Precious few retailers can boast that kind of consistency. However, WMT is not attracting the premium valuation that its business warrants, perhaps due to concerns about the growth of online retail (which are overstated). At ~$78/share, WMT has a price to economic book value ratio of only 0.8, implying a permanent 20% decline in NOPAT. Given WMT’s track record, it seems safe to bet that it will exceed the market’s pessimistic expectations for it.
Sam McBride contributed to this post.
Disclosure: David Trainer is long WMT. David Trainer and Sam McBride receive no compensation to write about any specific stock, sector, or theme.