Fund holdings affect fund performance more than fees or past performance. A cheap fund is not necessarily a good fund. A fund that has done well in the past is not likely to do well in the future (e.g. 5-star kiss of death and active management has long history of underperformance). Yet, traditional fund research focuses only on low fees and past performance.
Our research on holdings enables investors to find funds with high quality holdings – AND – low fees.
Investors are good at picking cheap funds. We want them to be better at picking funds with good stocks. Both are required to maximize success.
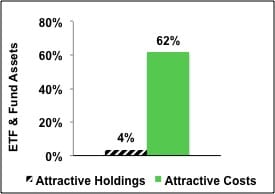
Figure 1 shows that 62% of fund assets are in ETFs and mutual funds with low costs but only 4% of assets are in ETFs and mutual funds with Attractive holdings. This discrepancy is astounding.
Figure 1: Allocation of Fund Assets By Holdings Quality and By Costs
 Sources: New Constructs, LLC and company filings
Two key shortcomings in the ETF and mutual fund industry cause this large discrepancy:
- A lack of research into the quality of holdings.
- Not enough research focuses on the quality of Portfolio Management of funds
- A lack of high-quality holdings or good stocks.
- With about twice as many funds as stocks in the market, there simply are not enough good stocks to fill all the funds.
These issues are related, in my opinion. If investors had more insight into the quality of funds’ holdings, I think they would allocate a lot less money to funds with poor quality holdings.
Investors deserve research on the quality of stocks held by ETFs and mutual funds.
Quality of holdings is the single most important factor in determining an ETF or mutual fund’s future performance. No matter how low the costs, if the ETF or mutual fund holds bad stocks, performance will be poor. Costs are easy to find but research on the quality of holdings is almost non-existent.
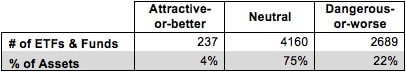
Figure 2 shows investors are not putting enough money into ETFs and mutual funds with high-quality holdings. Only 237 of 7086 (3% of assets) of ETFs and mutual funds allocate a significant amount of value to quality holdings. 97% of assets are in funds that do not justify their costs and over charge investors for poor portfolio management.
Figure 2: Distribution of ETFs & Mutual Funds (Count & Assets) By Portfolio Management Rating
 Sources: New Constructs, LLC and company filings
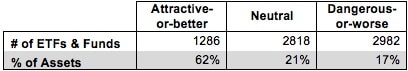
Figure 3 shows that investors successfully identify low-cost funds. 62% of assets are held in ETFs and mutual funds that have Attractive-or-better rated Total Annual Costs, my apples-to-apples measure of the all-in cost of investing in any given fund.
Out of the 7,086 ETFs and mutual funds I cover, 1,286 earn an Attractive-or-better Total Annual Costs rating.
Clearly, ETF and mutual funds investors are smart shoppers when it comes to finding cheap investments. But cheap is not necessarily good.
PowerShares S&P SmallCap Consumer Discretionary Portfolio (PSCD) is a great example of a fund with low costs but poor holdings. Its total annual costs are Very Attractive at only 0.32%. However, it still gets an overall predictive rating of Dangerous because no matter how low its fees, I expect it to underperform because it allocates 53% of its assets to Dangerous-or-worse rated stocks. Investors should not be paying fees, no matter how low, for a fund to simply hold their cash for them. Low fees cannot boost fund performance. Only good stocks can boost performance.
Fifth & Pacific (FNP) is one of my least favorite stocks held by PSCD and gets my Dangerous rating. FNP’s profits have declined by 10% compounded annually since 2000. FNP also has a return on invested capital of just 2%, which puts it in the bottom quintile of all companies I cover. Worst of all, FNP has earned negative economic earnings for the past seven years. Despite this evident decline, FNP is still significantly overpriced. To justify ~$23/share, FNP must grow NOPAT by 17% compounded annually for the next 10 years. Judging by management’s inability to stop profits from falling over the past 12 years, this looks unlikely. FNP’s valuation is out of touch with its profit history.
Heavy allocation to FNP helps to explain why PSCD earns its Dangerous rating despite having such low costs.
Figure 3: Distribution of ETFs & Mutual Funds (Count & Assets) By Total Annual Costs Ratings
 Sources: New Constructs, LLC and company filings
Investors should allocate their capital to funds with both high-quality holdings and low costs because those are the funds that offer investors the best performance potential.
But they do not. Not even close.
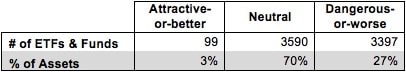
Figure 4 shows that 3% of ETF and mutual fund assets are allocated to funds with low costs and high-quality holdings according to my Predictive Fund Ratings, which are based on the quality of holdings and the all-in costs to investors.
Note the fund industry offers 3,397 Dangerous-or-worse ETFs and mutual funds compared to just 99 Attractive-or-better ETFs and mutual funds, over 30 times more bad funds than good funds. That means a lot of fees are being paid to managers that do not deserve them.
Figure 4: Distribution of ETFs & Mutual Funds (Count & Assets) By Predictive Ratings
 Sources: New Constructs, LLC and company filings
Investors deserve forward-looking ETF and mutual fund research that assesses both costs and quality of holdings. For example, Schwab US Dividend Equity ETF (SCHD) has Attractive total annual costs of only 0.08% and allocates over 54% of its assets to Attractive-or-better rated stocks. This fund is proof that investors can have their cake and eat it too.
Chevron Corporation (CVX) is one of my favorite stocks held by SCHD and earns my Attractive rating. CVX has grown after-tax profit (NOPAT) by an incredible 23% compounded annually over the past 14 years. It has maintained a double digit return on invested capital (ROIC) for eight out of the past nine years. CVX has also increased its proved natural gas reserves by 20% over the past two years, putting it in good position as natural gas steadily becomes a more important energy source.
Fortunately for investors, CVX is available at a nice discount currently. At its current valuation of ~$125/share, CVX has a price to economic book value ratio of only 0.8, implying a permanent 20% decline in NOPAT. Such a low valuation removes a significant amount of the downside risk to investing in CVX while increasing the potential reward to investors.
SCHD’s 5% allocation to CVX plays a large role in it earning my Attractive rating.
Anyone can look at the stocks held by funds, so why are most popular fund rating systems based on backward-looking past performance?
I do not know, but I do know that the lack of transparency into the quality of portfolio management provides cover for the ETF and mutual fund industry to continue to over charge investors for poor portfolio management. How else could they get away with selling 30 times more Dangerous-or-worse ETFs and mutual funds than Attractive-or-better?
John Bogle is correct – investors should not pay high fees for active portfolio management. His index funds have provided investors with many low-cost alternatives to actively managed funds.
However, by focusing entirely on costs, he overlooks the primary driver of fund performance: the stocks held by funds.
Research on the quality of portfolio management of funds empower empowers investors to make better investment decisions. Investors should no longer pay for poor portfolio management.
André Rouillard and Sam McBride contributed to this report.
Disclosure: David Trainer is long CVX. David Trainer, André Rouillard and Sam McBride receive no compensation to write about any specific stock, sector or theme.