Fund holdings affect fund performance more than fees or past performance. Why are there so many ETFs? The answer is: because ETF providers are making lots of money selling them. The number of ETFs has little to do with serving investors’ best interests. Below are three red flags investors can use to avoid the worst ETFs:
- Inadequate liquidity
- High fees
- Poor quality holdings
I address these red flags in order of difficulty. Advice on How to Find the Best Sector ETFs is here. Details on the Best & Worst ETFs in each sector are here.
How To Avoid ETFs with Inadequate Liquidity
This is the easiest issue to avoid and my advice is simple. Avoid all ETFs with less than $100 million in assets. Low levels of liquidity can lead to a discrepancy between the price of the ETF and the underlying value of the securities it holds. This makes it difficult to predict future performance.
How To Avoid High Fees
ETFs should be cheap, but not all of them are. The first step here is to know what is cheap and expensive.
To ensure you are paying at or below average fees, invest only in ETFs with an expense ratio below 0.55%, which is the average expense ratio of the 173 US equity ETFs I cover. Weighting the expense ratios by assets under management, the average expense ratio is lower at 0.31%. A lower weighted average is a good sign that investors are putting money in the cheaper ETFs.
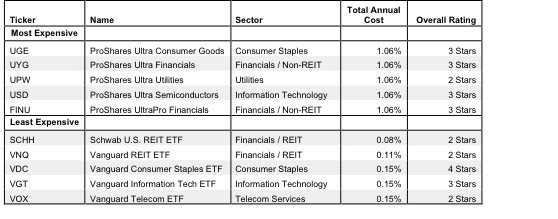
Figure 1 shows the most and least expensive sector ETFs in the US equity universe based on total annual costs. ProShares provides all five of the most expensive ETFs while Vanguard Group ETFs are among the cheapest.
Figure 1: Most and Least Expensive ETFs
 Sources: New Constructs, LLC and company filings
Proshares Ultra Consumer Goods (UGE) and ProShares Ultra Financials (UYG) are the two most expensive US equity ETFs I cover. Schwab U.S. REIT (SCHH) and Vanguard REIT (VNQ) are the least expensive. Ironically, UGE and UYG are also some of the better-rated ETFs in Figure 1, while most of the cheapest ETFs receive my 2-Star or Dangerous Rating. RXL and UGE earn Neutral ratings because the quality of their holdings is strong enough to offset their high costs.
However, investors need not pay high fees for good holdings. Vanguard Consumer Staples Select ETF (VDC) is my highest rated ETF and one of only five overall to get an Attractive (4-star) rating, yet it has a low total annual cost of 0.15%. Investors do not need to pay high fees for funds with good stocks.
On the other hand, SCHH and VNQ hold poor stocks. And no matter how cheap an ETF, if it holds bad stocks, its performance will be bad.
This result highlights why investors should not choose ETFs based only on price. The quality of holdings matters more than price.
How To Avoid ETFs with the Worst Holdings
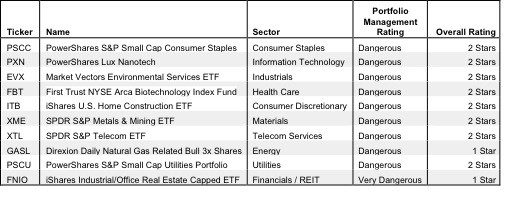
This step is by far the hardest, but it is also the most important because an ETF’s performance is determined more by its holdings than its costs. Figure 2 shows the ETFs within each sector with the worst holdings or portfolio management ratings. The sectors are listed in descending order by overall rating as detailed in my 3Q Sector Ratings report.
Figure 2: Sector ETFs With the Worst Holdings
Sources: New Constructs, LLC and company filings
My overall ratings on ETFs are based primarily on my stock ratings of their holdings. My firm covers over 3000 stocks and is known for the due diligence done on each stock we cover.
iShares and PowerShares ETFs appear more often than any other providers in Figure 2, which means that they offer the most ETFs with the worst holdings. iShares Industrial/Office Capped Index Fund (FNIO) has the worst holdings of all Financials ETFs and the worst holdings overall of any ETF. PowerShares S&P SmallCap Consumer Staples Portfolio (PSCC), PowerShares Lux Nanotech Portfolio (PXN), Market Vectors Environmental Services ETF (EVX), First Trust NYSE Arca Biotechnology Index Fund (FBT), iShares Dow Jones U.S. Home Construction Index Fund (ITB), SPDR S&P Metals and Mining ETF (XME), SPDR S&P Telecom ETF (XTL), Direxion Daily Natural Gas Related Bull 3x Shares (GASL), PowerShares S&P Small Cap Utilities Portfolio (PSCU) and iShares Industrial/Office Real Estate Capped ETF (FNIO) all have the worst holdings in their respective sectors.
Note that no ETFs with a dangerous portfolio management rating earn an overall rating better than two stars. These scores are consistent with my belief that the quality of an ETF is more about its holdings than its costs. If the ETF’s holdings are dangerous, then the overall rating cannot be better than dangerous because one cannot expect the performance of the ETF to be any better than the performance of its holdings.
Figure 2 reveals that two of the cheapest ETFs, PSCC and PSCU, get a Dangerous ratings because their holdings get my Dangerous rating. Again, the ETF’s overall rating cannot be any better than the rating of its holdings.
Find the ETFs with the worst overall ratings on my ETF screener. More analysis of the Best Sector ETFs is here.
The Danger Within
Buying an ETF without analyzing its holdings is like buying a stock without analyzing its business and finances. As Barron’s says, investors should know the Danger Within. Put another way, research on ETF holdings is necessary due diligence because an ETF’s performance is only as good as its holdings’ performance.
PERFORMANCE OF ETF’s HOLDINGs = PERFORMANCE OF ETF
Best & Worst Stocks In these ETFs
BioMed Realty Trust (BMR) is one of worst stocks I cover. It’s one of FNIO’s top 10 holdings and earns my Very Dangerous rating. BMR has misleading earnings, which means that its economic earnings are negative and declining while it’s reported accounting earnings are increasing. In fact, during the last 8 years, the company has never generated positive economic earnings. BMR also has a return on invested capital (ROIC) of only 3%, which puts it in the bottom quintile of all companies. Despite this, BMR is trading at ~$21/share. To justify this stock price, the company must increase after tax profits (NOPAT) by 15% compounded annually for the next 21 years.
This kind of long-term growth is a tall order for any company. It does not look likely that BMR, with its profits down 10% since 2009, will meet this target any time soon. Recent market developments as detailed in my Danger Zone article indicate that REITs, aside from being generally expensive stocks, are becoming increasingly risky as interest rates rise. There is too much risk built into this stock price and investors should steer clear of BMR.
Colgate-Palmolive (CL) is one of favorite holdings in VDC, the only low-cost ETFs in Figure 1 to get my 4-star rating. CL gets my Very Attractive rating. CL has a return on invested capital (ROIC) of over 22%, which places it in the top quintile of all companies. CL has also grown economic earnings by 14% compounded annually since the beginning of my model in 1998. Despite this strong track record, CL is trading at ~$58/share, which gives it a price to economic book value ratio of 1.1. This ratio means that based on CL’s stock price, the market expects CL’s profits (NOPAT) to increase by 10%. Seeing as CL has increased profits by 8% compounded annually for the past 14 years, this expectation looks very likely. CL is priced right for investors to buy in now with little potential downside. The fact that CL is in VDC’s top ten holdings helps explain why this ETF earns my Attractive rating.
André Rouillard contributed to this article
Disclosure: David Trainer and André Rouillard receive no compensation to write about any specific stock, sector, or theme.