
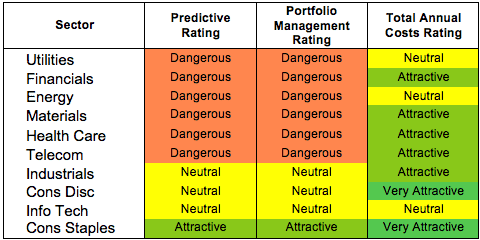
At the beginning of the fourth quarter of 2013, only the Consumer Staples sector earns an Attractive rating. My sector ratings are based on the aggregation of my fund ratings for every ETF and mutual fund in each sector.
Investors looking for sector funds that hold quality stocks should look no further than the Consumer Staples and Info Tech sectors. Only these sectors house Attractive-or-better rated funds. Figures 6 and 7 provide details. The primary driver behind an Attractive fund rating is good portfolio management, or good stock picking, with low total annual costs.
Note that the Attractive-or-better Predictive ratings do not always correlate with Attractive-or-better total annual costs. This fact underscores that (1) low fees can dupe investors and (2) investors should invest only in funds with good stocks and low fees.
See Figures 4 through 13 for a detailed breakdown of ratings distributions by sector. See my free ETF & mutual fund screener for rankings, ratings and free reports on 7000+ mutual funds and 400+ ETFs. My fund rating methodology is detailed here.
All of my reports on the best & worst ETFs and mutual funds in every sector and investment style are available here.
Figure 1: Ratings For All Sectors
 Source: New Constructs, LLC and company filings
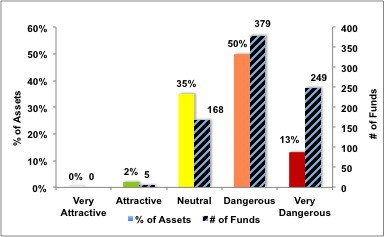
To earn an Attractive-or-better Predictive Rating, an ETF or mutual fund must have high-quality holdings and low costs. Only five sector ETFs and mutual funds meet these requirements, which is only 2% of all sector ETFs and mutual funds.
Vanguard Consumer Staples ETF (VDC) is my top Consumer Staples ETF. It gets my Attractive rating by allocating over 45% of its value to Attractive-or-better-rated stocks.
Wal-Mart Stores, Inc. (WMT) is one of my favorite stocks held by VDC. As highlighted in Wal-Mart: Still Offering Great Value, WMT is one of the most consistent companies we cover. The business has grown after tax profit (NOPAT) by 11% compounded annually for the past 15 years. NOPAT increased every single year during that timeframe. Such consistency typically commands a high valuation, but the market has curiously low expectations for WMT. Trading at ~$73.20/share, the stock has a price to economic book value ratio of 0.8, which means the market expects WMT’s NOPAT to permanently decline by 20%. For a company with a proven track record of growth, such pessimistic expectations seem unwarranted. WMT’s low valuation, combined with its impressive historical performance, offers investors a high potential reward with very little risk.
Rydex Series Real Estate Fund (RYREX) is my worst Financials Mutual Fund. It gets my Very Dangerous rating by allocating over 75% of its value to Neutral-or-worse-rated stocks, and to make matters worse, charges investors annual costs of 7.32%.
Ventas Inc. (VTR) is one of my least favorite stocks held by RYREX and gets my Very Dangerous rating. VTR has benefited from the rapidly aging US population as over 50% of its business is providing senior housing facilities. However, its business model is now under pressure from increasing competition in the industry as small new firms are jumping into the market and driving down margins and returns on invested capital (ROIC). VTR has seen its ROIC decline from 177% in 2003 down to 3.5% in 2012. Declining ROIC has lead to VTR making negative economic earnings for the past two years. The market, however, seems focused on the favorable demographic trends and the misleading rise in GAAP net income to project very high expectations onto VTR. The company’s current share price of ~$62 implies 20% growth in NOPAT over 15 years. Betting on that kind of growth, for any company, is a risky proposition. For more analysis on VTR see “Danger Zone 3/18/2013: Ventas Inc. (VTR)”.
Figure 2 shows the distribution of our Predictive Ratings for all sector ETFs and mutual funds.
Figure 2: Distribution of ETFs & Mutual Funds (Assets and Count) by Predictive Rating
 Source: New Constructs, LLC and company filings
Figure 3 offers additional details on the quality of the sector funds. Note that the average Total Annual Cost of Very Dangerous funds is almost 12 times that of Attractive funds.
Figure 3: Predictive Rating Distribution Stats
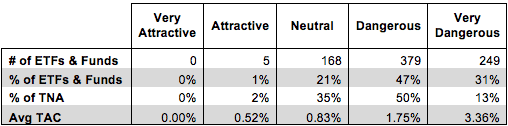 * Avg TAC = Weighted Average Total Annual Costs
Source: New Constructs, LLC and company filings
This table shows that only the best of the best funds get our Very Attractive Rating: they must hold good stocks AND have low costs. Investors deserve to have the best of both and we are here to give it to them.
Ratings by Sector
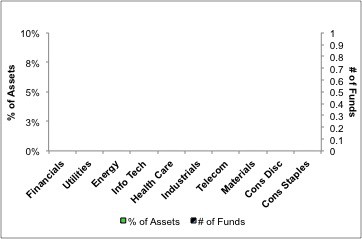
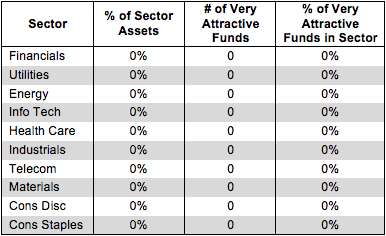
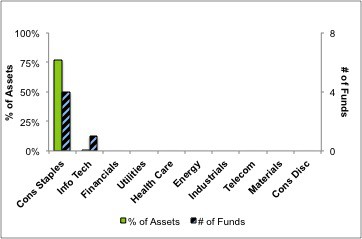
Figure 4 presents a mapping of Very Attractive funds by sector. The chart shows the number of Very Attractive funds in each sector and the percentage of assets in each sector allocated to funds that are rated Very Attractive.
No sector funds earn my Very Attractive rating. This is unusual. Normally, at least one or two sector funds allocate sufficiently to Attractive and Very Attractive stocks to earn my highest rating.
Figure 4: Very Attractive ETFs & Mutual Funds by Sector
 Source: New Constructs, LLC and company filings
Figure 5 presents the data charted in Figure 4.
Figure 5: Very Attractive ETFs & Mutual Funds by Sector
 Source: New Constructs, LLC and company filings
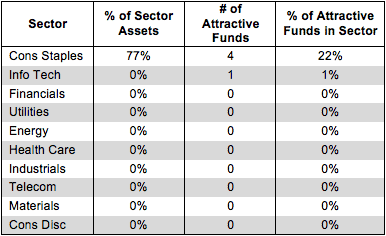
Figure 6 presents a mapping of Attractive funds by sector. The chart shows the number of Attractive funds in each sector and the percentage of assets allocated to Attractive-rated funds in each sector.
Note that the Consumer Staples and Information Technology sectors are the only sectors that house Attractive-rated funds. Only one fund in the Information Technology sector was rated as Attractive, amounting to less than 1% of assets in the sector.
Figure 6: Attractive ETFs & Mutual Funds by Sector
 Source: New Constructs, LLC and company filings
Figure 7 presents the data charted in Figure 6.
Figure 7: Attractive ETFs & Mutual Funds by Sector
 Source: New Constructs, LLC and company filings
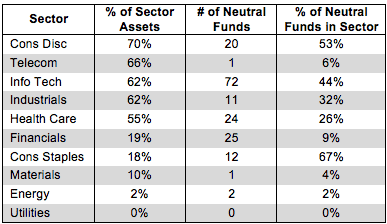
Figure 8 presents a mapping of Neutral funds by sector. The chart shows the number of Neutral funds in each sector and the percentage of assets allocated to Neutral-rated funds in each sector.
Figure 8: Neutral ETFs & Mutual Funds by Sector
 Source: New Constructs, LLC and company filings
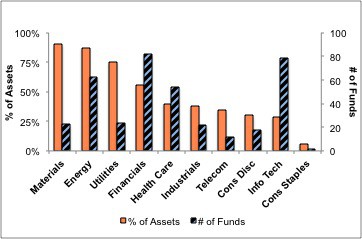
Figure 9 presents the data charted in Figure 8.
Figure 9: Neutral ETFs & Mutual Funds by Sector
 Source: New Constructs, LLC and company filings
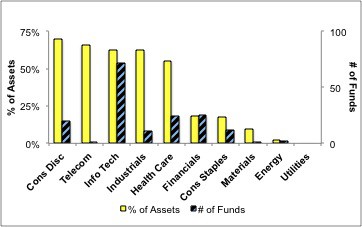
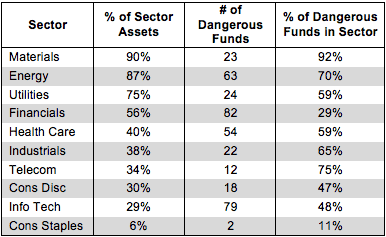
Figure 10 presents a mapping of Dangerous funds by fund sector. The chart shows the number of Dangerous funds in each sector and the percentage of assets allocated to Dangerous-rated funds in each sector.
The landscape of sector ETFs and mutual funds is littered with Dangerous funds. Over 70% of the total assets in The Materials, Energy, and Utilities sectors are in Dangerous-rated funds.
Figure 10: Dangerous ETFs & Mutual Funds by Sector
 Source: New Constructs, LLC and company filings
Figure 11 presents the data charted in Figure 10.
Figure 11: Dangerous ETFs & Mutual Funds by Sector
 Source: New Constructs, LLC and company filings
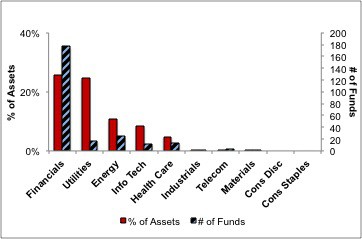
Figure 12 presents a mapping of Very Dangerous funds by fund sector. The chart shows the number of Very Dangerous funds in each sector and the percentage of assets in each sector allocated to funds that are rated Very Dangerous.
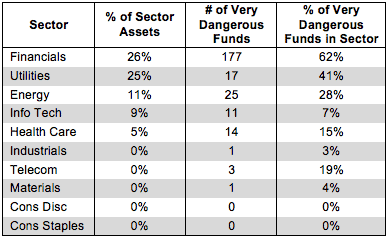
With over 177 Very Dangerous funds in the Financials sector alone, investors have a very difficult time finding quality funds amongst the abundance of funds with poor holdings and high costs.
Figure 12: Very Dangerous ETFs & Mutual Funds by Sector
 Source: New Constructs, LLC and company filings
Figure 13 presents the data charted in Figure 12.
Figure 13: Very Dangerous ETFs & Mutual Funds by Sector
 Source: New Constructs, LLC and company filings
Jared Melnyk and Sam McBride contributed to this report
Disclosure: David Trainer is long WMT. David Trainer, Sam McBride, and Jared Melnyk receive no compensation to write about any specific stock, sector or theme.