This report focuses on my top picks and pans for all sector funds. I will follow this summary with a detailed report on each sector.
My top ETFs and mutual funds have high-quality holdings and low costs. As detailed in “Low-cost funds dupe investors”, there are few funds that have both good holdings and low costs. While there are lots of cheap funds, there are very few with high-quality holdings.
I think there are at least two causes for this disconnect. First, there is, in general, a lack of independent research on ETFs and funds. Second, I think it is fair to say that there is a severe lack of quality research into the holdings of mutual funds and ETFs. There should not be such a large gap between the quality of research on stocks and funds, which are simply groups of stocks.
After all, investors should care more about the quality of a fund’s holdings than its costs because the quality of a fund’s holdings is the single most important factor in determining its future performance.
My Predictive Rating system rates 6900+ ETFs and mutual funds according to the quality of their holdings (Portfolio Management Rating) and their costs (Total Annual Costs Rating).
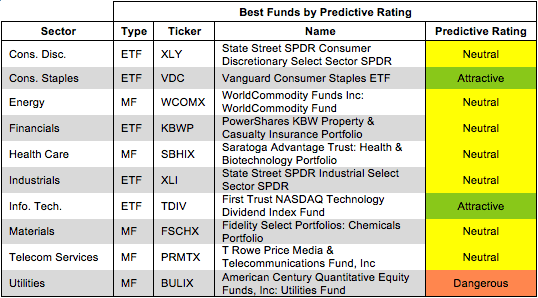
Figures 1 shows the best ETF or mutual fund in each sector as of October 3, 2013.
For a full list of all ETFs and mutual funds for each sector ranked from best to worst, see my free ETF & mutual fund screener.
Figure 1: Best ETF or Mutual Fund In Each Sector
 Source: New Constructs, LLC and company filings
Vanguard Consumer Staples ETF (VDC) is my highest rated Consumer Staples ETF and earns my Attractive rating. VDC allocates over 46% of its assets to Attractive-or-better rated stocks and has low total annual costs of only 0.15%.
The Coca-Cola Company (KO) is one of my favorite stocks held by VDC. The power of the Coke brand can be seen in the company’s consistently high return on invested capital (ROIC), which currently stands at 14%. KO has diversified outside of soft drinks as well, and its other brands like Dasani, Powerade, and Minute Maid are also very succesful. One would expect a blue chip company like KO to command a high valuation, but the stock is actually very reasonably priced. At a stock price of ~$37/share, KO has price to economic book value of only 1.15, which implies that the market expects KO to grow after-tax profit (NOPAT) by only 15% for the remainder of its corporate life. Such a pessimistic outlook seems unwarranted for such a consistently high performing company.
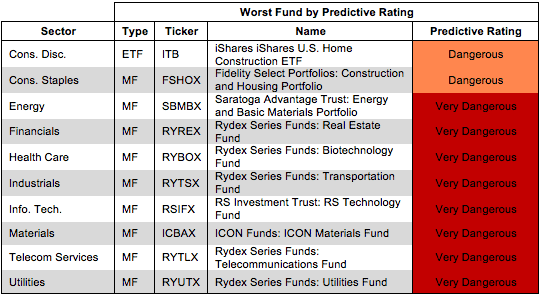
Figure 2 shows the worst ETF or mutual fund for each sector as of October 1, 2013.
Dangerous-or-worse-rated funds have a combination of low-quality portfolios (i.e. they hold too many Dangerous-or-worse rated stocks) and high costs (they charge investors too much for the [lack of] management they provide).
Figure 2: Worst ETF or Mutual Fund In Each Sector
 Source: New Constructs, LLC and company filings
Rydex Series Funds: Transportation Fund (RYTSX) is my worst-rated Industrials mutual fund and earns my Very Dangerous rating. RYTSX allocates over 33% of its assets to Dangerous-or-worse stocks and charges investors exorbitant total annual costs of 5.23%.
FedEx Corporation (FDX) is one of my least favorite stocks held by RYTSX and earns my Dangerous rating. FDX is losing the delivery war to UPS. It earns an ROIC of 6% compared to 23% for UPS, and its NOPAT margins are only 5.5% compared to almost 14% for UPS. FDX also has $4 billion in underfunded pensions and $15 billion of adjusted total debt (including $12 billion in off-balance sheet debt).
On top of these issues, FDX is richly priced at ~$114/share. To justify that share price, FDX would need to grow NOPAT by 10% compounded annually for 18 years. It’s hard to justify investing in many companies with that level of growth baked into the stock price. Combine that high valuation with a more efficient competitor, and FDX becomes a high risk/low reward investment.
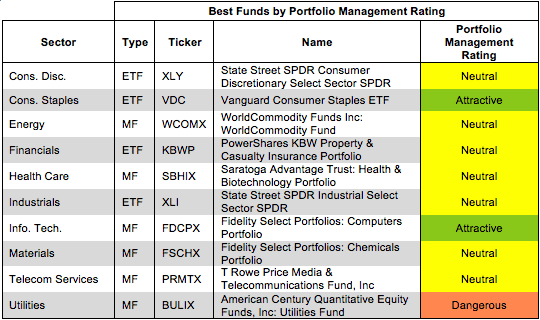
Traditional mutual fund research has focused on past performance and low management costs. The quality of a fund’s holdings has been ignored. Our Portfolio Management Rating examines the fund’s holdings in detail and takes into account the fund’s allocation to cash. Our models are created with data from over 50,000 annual reports. This kind of due diligence is necessary for understanding just what you are buying when you invest in a mutual fund or an ETF.
Figure 3 shows the best ETF or mutual fund based on our Portfolio Management Rating for each sector as of October 3, 2013.
Attractive-or-better-rated funds own high-quality stocks and hold very little of the fund’s assets in cash – investors looking to hold cash can do so themselves without paying management fees. Less than 1% of sector ETFs and mutual funds receive my Attractive or Very Attractive Portfolio Management ratings, so investors need to be cautious when selecting a sector mutual fund or ETF – over 500 sector ETFs and mutual funds earn my Dangerous or Very Dangerous Portfolio Management ratings.
Figure 3: ETF or Mutual Fund With Highest Quality Holdings by Sector
 Source: New Constructs, LLC and company filings
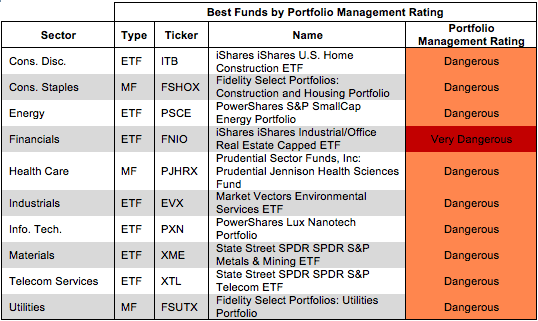
Figure 4 shows the worst ETF or mutual fund based on our Portfolio Management Rating for each sector as of October 1, 2013.
Many ETFs and mutual funds managers do a poor job identifying quality stocks. These funds are not worth owning at any cost.
Figure 4: ETF or Mutual Fund With Lowest Quality Holdings by Sector
 Source: New Constructs, LLC and company filings
Investors should care about all of the fees associated with a fund in addition to the quality of the fund’s holdings. The best ETFs and mutual funds have both low costs and quality holdings – and there are plenty of low cost funds available to investors.
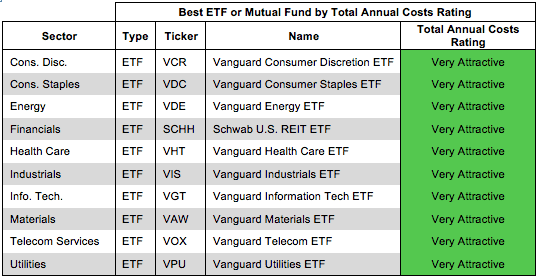
Figure 5 shows the best ETF or mutual fund in each sector according to our Total Annual Costs Rating.
Total Annual Costs incorporates all expenses, loads, fees, and transaction costs into a single value that is comparable across all ETFs and mutual funds. Passively managed ETFs and index mutual funds are generally the cheapest.
Figure 5: ETF or Mutual Fund With Lowest Costs by Sector
 Source: New Constructs, LLC and company filings
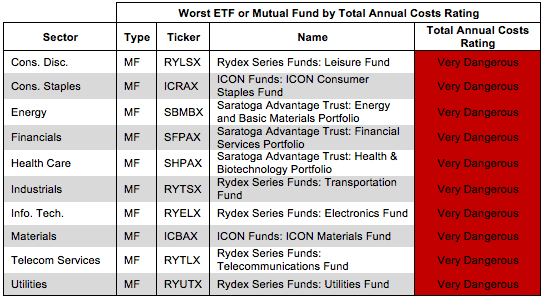
Figures 6 shows the worst fund in each sector according to our Total Annual Costs Rating.
The most expensive fund for each sector has a Very Dangerous Total Annual Costs Rating. Investors should avoid these funds and other funds with Very Dangerous Total Annual Costs Ratings because they charge investors too much. For every fund with a Very Dangerous Total Annual Costs Rating there is an alternative fund that offers similar exposure and holdings at a lower cost. We cover over 6500 mutual funds and over 400 ETFs and the ratings of each can be found at our free ETF & mutual fund screener. Investors have plenty of alternatives to these overpriced funds.
Figure 6: ETF or Mutual Fund With Highest Costs by Sector
 Source: New Constructs, LLC and company filings
Sam McBride contributed to this report.
Disclosure: David Trainer and Sam McBride receive no compensation to write about any specific stock, sector or theme.