
The Financials sector ranks ninth out of the ten sectors as detailed in my Sector Rankings for ETFs and Mutual Funds report. It gets my Dangerous rating, which is based on aggregation of ratings of 44 ETFs and 230 mutual funds in the Financials sector as of October 7, 2013. Prior reports on the best & worst ETFs and mutual funds in every sector are here.
Figures 1 and 2 show the five best and worst-rated ETFs and mutual funds in the sector. Not all Financials sector ETFs and mutual funds are created the same. The number of holdings varies widely (from 22 to 536), which creates drastically different investment implications and ratings. The best ETFs and mutual funds allocate more value to Attractive-or-better-rated stocks than the worst ETFs and mutual funds, which allocate too much value to Neutral-or-worse-rated stocks.
To identify the best and avoid the worst ETFs and mutual funds within the Financials sector, investors need a predictive rating based on (1) stocks ratings of the holdings and (2) the all-in expenses of each ETF and mutual fund. Investors need not rely on backward-looking ratings. My fund rating methodology is detailed here.
Investors should not buy any Financials ETFs or mutual funds because none get an Attractive-or-better rating. If you must have exposure to this sector, you should buy a basket of Attractive-or-better rated stocks and avoid paying undeserved fund fees. Active management has a long history of not paying off. Here’s the list of our top-rated Financial Sector stocks.
Get my ratings on all ETFs and mutual funds in this sector on my free mutual fund and ETF screener.
Figure 1: ETFs with the Best & Worst Ratings – Top 5
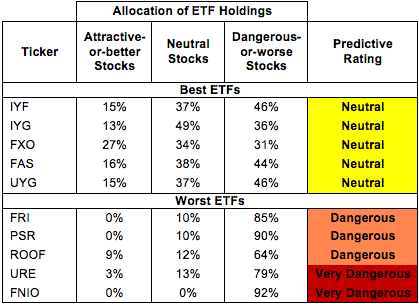 * Best ETFs exclude ETFs with TNAs less than $100 million for inadequate liquidity.
Sources: New Constructs, LLC and company filings
PowerShares KBW Property & Casualty Insurance Portfolio (KBWP), PowerShares KBW Capital Markets Portfolio (KBWC) and ProShares UltraPro Financials (FINU) are excluded from Figure 1 because their total net assets (TNA) are below $100 million and do not meet our liquidity minimums.
Figure 2: Mutual Funds with the Best & Worst Ratings – Top 5
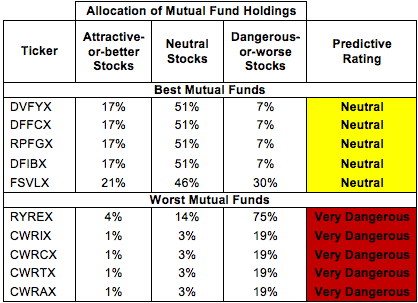 * Best mutual funds exclude funds with TNAs less than $100 million for inadequate liquidity.
Sources: New Constructs, LLC and company filings
iShares U.S. Financials ETF (IYF) is my top-rated Financials ETF and Davis Series, Inc: Davis Financial Fund (DFFCX) is my top-rated Financials mutual fund. Both earn my Neutral rating.
iShares Industrial/Office Real Estate Capped ETF (FNIO) is my worst-rated Financials ETF and Compass EMP Funds Trust: Compass EMP REC Enhanced Volatility Weighted Fund (CWRAX) is my worst-rated Financials mutual fund. Both earn my Very Dangerous rating.
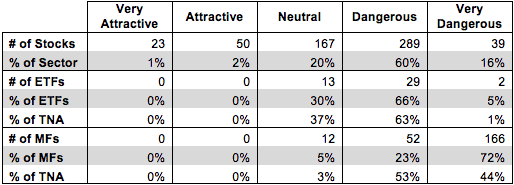
Figure 3 shows that 74 out of the 568 stocks (over 3% of the market value) in Financials ETFs and mutual funds get an Attractive-or-better rating. However, not a single Financials ETF or mutual fund holds enough quality stocks to merit an Attractive-or-better rating.
The takeaways are: mutual fund managers allocate too much capital to low-quality stocks and Financials ETFs hold poor quality stocks.
Figure 3: Financials Sector Landscape For ETFs, Mutual Funds & Stocks
 Sources: New Constructs, LLC and company filings
As detailed in “Cheap Funds Dupe Investors”, the fund industry offers many cheap funds but very few funds with high-quality stocks, or with what I call good portfolio management.
Investors need to tread carefully when considering Financials ETFs and mutual funds, as 31 of 44 Financials ETFs (64% of net assets) and 218 of 230 Financials mutual funds (97% of net assets) earn a Dangerous-or-worse rating. No Financials ETFs or mutual funds in the Financials sector allocate enough value to Attractive-or-better-rated stocks to earn an Attractive rating. Investors seeking exposure to the financials sector are better off by focusing on individual stocks.
Assured Guaranty, Ltd. (AGO) is one of my favorite stocks held by Financials ETFs and mutual funds and earns my Very Attractive rating. Assured Guaranty, Ltd. Has increased net operating profit after taxes (NOPAT) by 22% compounded annually over the past nine years. AGO also has a strong NOPAT margin of 49%. Returns on Invested Capital (ROIC) have increased from 4% in 2011 to 15% in 2012, placing Assured Guaranty in the top quintile of stocks that I cover.
Despite its strong profit growth track record, AGO trades at a price-to-economic book value (PEBV) ratio of only 0.4. Its current stock price of ~$20 implies the market expects profits (NOPAT) to permanently decline by 60%. Given its strong history of NOPAT growth over the past nine years, this expectation seems too pessimistic. Investors should consider buying this stock while it is still available at a discount.
The Charles Schwab Corp (SCHW) is one of my least favorite stocks held by Financials ETFs and mutual funds and earns my Very Dangerous rating. I put Charles Schwab Corp in the Danger Zone this past May and it is currently on my list of Most Dangerous stocks for October. The online investing firm has had profits (NOPAT) decline by 5% compounded annually over the past five years. Schwab also has realized negative economic earnings for the past three years straight. Return on invested capital (ROIC) has dropped from 16% in 2008 to a mere 7% in 2012, putting it in the second-lowest quintile of stocks that I cover.
At its current stock price of ~$22, SCHW has a price to economic book value (PEBV) ratio of 3.6. At this high valuation, the stock embeds expectation for NOPAT to grow by 20% compounded annually over the next 13 years. Given SCHW’s 5% annual decline in profits over the past five years, this expectation seems overly optimistic. Investors would be wise to steer clear of SCHW.
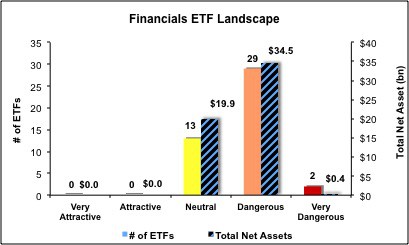
Figures 4 and 5 show the rating landscape of all Financials ETFs and mutual funds.
My Sector Rankings for ETFs and Mutual Funds report ranks all sectors and highlights those that offer the best investments.
Figure 4: Separating the Best ETFs From the Worst ETFs
 Sources: New Constructs, LLC and company filings
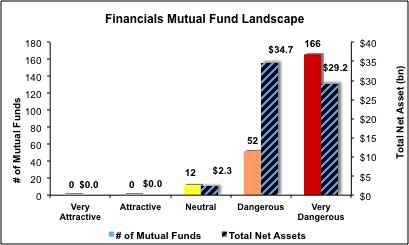
Figure 5: Separating the Best Mutual Funds From the Worst Mutual Funds
 Sources: New Constructs, LLC and company filings
Review my full list of ratings and rankings along with reports on all 44 ETFs and 230 mutual funds in the Financials sector.
Jared Melnyk contributed to this report.
Disclosure: David Trainer is long AGO. David Trainer and Jared Melnyk receive no compensation to write about any specific stock, sector or theme.