
The Utilities sector ranks tenth out of the ten sectors as detailed in my Sector Rankings for ETFs and Mutual Funds report. It gets my Dangerous rating, which is based on aggregation of ratings of eight ETFs and 33 mutual funds in the Utilities sector as of October 11, 2013. Prior reports on the best & worst ETFs and mutual funds in every sector are here.
Figure 1 ranks from best to worst all eight Utilities ETFs and Figure 2 shows the five best and worst-rated Utilities mutual funds. Not all Utilities sector ETFs and mutual funds are created the same. The number of holdings varies widely (from 20 to 80). This variation creates drastically different investment implications and, therefore, ratings. The best ETFs and mutual funds allocate more value to Attractive-or-better-rated stocks than the worst ETFs and mutual funds, which allocate too much value to Neutral-or-worse-rated stocks.
To identify the best and avoid the worst ETFs and mutual funds within the Utilities sector, investors need a predictive rating based on (1) stocks ratings of the holdings and (2) the all-in expenses of each ETF and mutual fund. Investors need not rely on backward-looking ratings. My fund rating methodology is detailed here.
Investors should not buy any Utilities ETFs or mutual funds because none get an Attractive-or-better rating. If you must have exposure to this sector, you should buy a basket of Attractive-or-better rated stocks and avoid paying undeserved fund fees. Active management has a long history of not paying off. Here’s the list of our top-rated Utilities stocks.
Get my ratings on all ETFs and mutual funds in this sector on my free mutual fund and ETF screener.
Figure 1: ETFs with the Best & Worst Ratings – Top 4
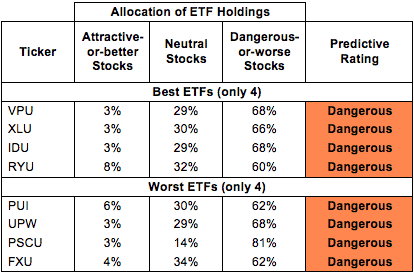 * Best ETFs exclude ETFs with TNAs less than $100 million for inadequate liquidity.
Sources: New Constructs, LLC and company filings
Figure 2: Mutual Funds with the Best & Worst Ratings – Top 5
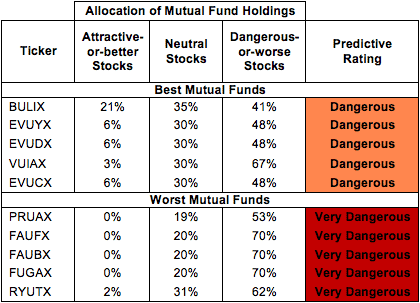 * Best mutual funds exclude funds with TNAs less than $100 million for inadequate liquidity.
Sources: New Constructs, LLC and company filings
ICON Funds: ICON Utilities Fund (ICTUX, ICTZX) is excluded from Figure 2 because its total net assets (TNA) are below $100 million and do not meet our liquidity minimums.
Vanguard Utilities ETF (VPU) is my top-rated Utilities ETF and American Century Quantitative Equity Funds: Utilities Fund (BULIX) is my top-rated Utilities mutual fund. Both earn my Dangerous rating.
First Trust Utilities AlphaDEX Fund (FXU) is my worst-rated Utilities ETF and Rydex Series Funds: Utilities Fund (RYUTX) is my worst-rated Utilities mutual fund. FXU earns my Dangerous rating and RYUTX earns my Very Dangerous rating.
Figure 3 shows that 48 out of the 141 stocks (over 32% of the market value) in Utilities ETFs and mutual funds get a Neutral-or-better rating. However, no Utilities ETFs or mutual funds earn allocate enough value to Neutral-or-better stocks to earn a Neutral rating.
The takeaways are: mutual fund managers allocate too much capital to low-quality stocks and Utilities ETFs hold poor quality stocks.
Figure 3: Utilities Sector Landscape For ETFs, Mutual Funds & Stocks
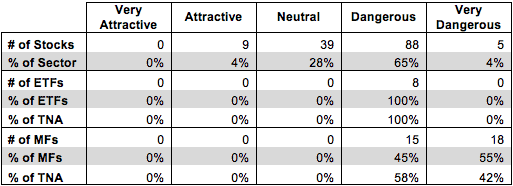 Sources: New Constructs, LLC and company filings
As detailed in “Cheap Funds Dupe Investors”, the fund industry offers many cheap funds but very few funds with high-quality stocks, or with what I call good portfolio management.
Investors need to tread carefully when considering Utilities ETFs and mutual funds, as all eight Utilities ETFs and all 33 mutual funds in the sector earn a Dangerous-or-worse rating. Investors should focus on individual stocks instead.
Consolidated Edison (ED) is one of my favorite stocks held by Utilities ETFs and mutual funds and earns my Attractive rating. ED has growing economic earnings and positive free cash flow, two signs of a company that is creating value for investors. Over the past 10 years, ED has grown after-tax profit (NOPAT) by 8% compounded annually. What really makes ED an enticing prospect for investors is its valuation. At its current valuation of ~$56/share, ED has a price to economic book value ratio of only 0.9. This low valuation implies that ED’s NOPAT will permanently decline by 10%. ED is a solid, stable company, and it should have no problem exceeding the market’s low expectations.
South Jersey Industries (SJI) is one of my least favorite stocks held by Utilities ETFs and mutual funds and earns my Very Dangerous rating. SJI’s return on invested capital (ROIC) has declined from 7% in 2006 to 4% in 2012. Even worse, SJI’s ROIC has been lower than its weighted average cost of capital (WACC) in every year going back to 1998, which means the company has had negative economic earnings in every year of our model. To justify its current valuation of ~$58/share, SJI would need to grow NOPAT by 10% compounded annually for 15 years. For a company with negative and declining economic profits, such a high growth expectation seems overly optimistic.
84 stocks of the 3000+ I cover are classified as Utilities stocks, but due to style drift, Utilities ETFs and mutual funds hold 141 stocks.
Figures 4 and 5 show the rating landscape of all Utilities ETFs and mutual funds.
My Sector Rankings for ETFs and Mutual Funds report ranks all sectors and highlights those that offer the best investments.
Figure 4: Separating the Best ETFs From the Worst ETFs
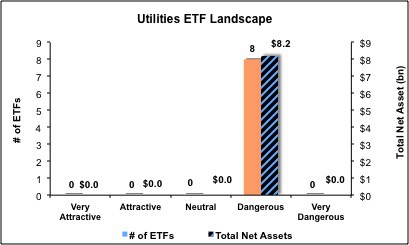 Sources: New Constructs, LLC and company filings
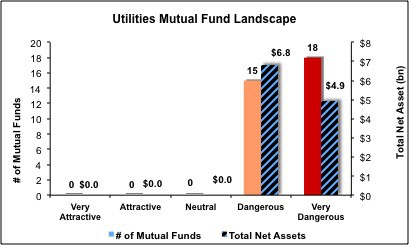
Figure 5: Separating the Best Mutual Funds From the Worst Mutual Funds
 Sources: New Constructs, LLC and company filings
Review my full list of ratings and rankings along with reports on all eight ETFs and 33 mutual funds in the Utilities sector.
Sam McBride contributed to this report.
Disclosure: David Trainer and Sam McBride receive no compensation to write about any specific stock, sector or theme.