
The All Cap Blend style ranks second out of the twelve fund styles as detailed in my Style Rankings for ETFs and Mutual Funds report. It gets my Neutral rating, which is based on aggregation of ratings of 38 ETFs and 738 mutual funds in the All Cap Blend style as of January 24, 2014. Prior reports on the best & worst ETFs and mutual funds in every sector and style are here.
Figures 1 and 2 show the five best and worst-rated ETFs and mutual funds in the style. Not all All Cap Blend style ETFs and mutual funds are created the same. The number of holdings varies widely (from 6 to 3593). This variation creates drastically different investment implications and, therefore, ratings. The best ETFs and mutual funds allocate more value to Attractive-or-better-rated stocks than the worst, which allocate too much value to Neutral-or-worse-rated stocks.
To identify the best and avoid the worst ETFs and mutual funds within the All Cap Blend style, investors need a predictive rating based on (1) stocks ratings of the holdings and (2) the all-in expenses of each ETF and mutual fund. Investors need not rely on backward-looking ratings. My fund rating methodology is detailed here.
Investors should not buy any All Cap Blend ETFs or mutual funds because none get an Attractive-or-better rating. If you must have exposure to this style, you should buy a basket of Attractive-or-better rated stocks and avoid paying undeserved fund fees. Active management has a long history of not paying off. Here’s the list of our top-rated All Cap Blend stocks.
Get my ratings on all ETFs and mutual funds in this style by searching for All Cap Blend on my free mutual fund and ETF screener.
Figure 1: ETFs with the Best & Worst Ratings – Top 5
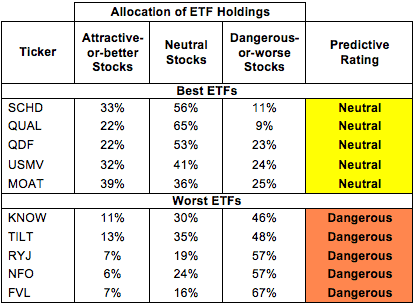 * Best ETFs exclude ETFs with TNAs less than $100 million for inadequate liquidity.
Sources: New Constructs, LLC and company filings
FlexShares Northern Trust Quality Dividend Defensive Index (QDEF) and FlexShares Quality Dividend Dynamic Index Fund (QDYN) are excluded from Figure 1 because their total net assets (TNA) are below $100 million and do not meet our liquidity minimums.
Figure 2: Mutual Funds with the Best & Worst Ratings – Top 5
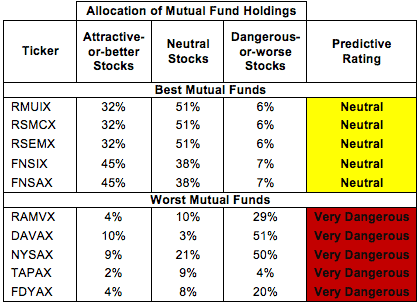 * Best mutual funds exclude funds with TNAs less than $100 million for inadequate liquidity.
Sources: New Constructs, LLC and company filings
Madison Dividend Income Fund (BHBFX) and two Jensen Quality Value Funds (JNVIX) (JNVSX) are excluded from Figure 2 because their total net assets (TNA) are below $100 million and do not meet our liquidity minimums.
Schwab U.S. Dividend Equity ETF (SCHD) is my top-rated All Cap Blend ETF and Royce Special Equity Multi-Cap Fund (RMUIX) is my top-rated All Cap Blend mutual fund. Both earn my Neutral rating.
First Trust Value Line 100 ETF (FVL) is my worst-rated All Cap Blend ETF and Forward Dynamic Income Fund (FDYAX) is my worst-rated All Cap Blend mutual fund. FVL earns my Dangerous rating, while FDYAX earns my Very Dangerous rating.
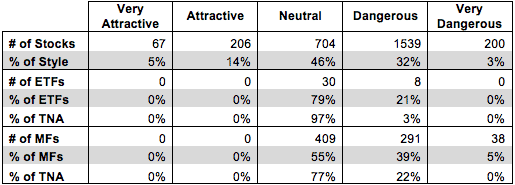
Figure 3 shows that 273 out of the 2716 stocks (over 19% of the market value) in All Cap Blend ETFs and mutual funds get an Attractive-or-better rating. However, zero out of 38 All Cap Blend ETFs and zero out of 738 All Cap Blend mutual funds get an Attractive-or-better rating.
The takeaways are: mutual fund managers allocate too much capital to low-quality stocks and All Cap Blend ETFs hold poor quality stocks.
Figure 3: All Cap Blend Style Landscape For ETFs, Mutual Funds & Stocks
 Sources: New Constructs, LLC and company filings
As detailed in “Low-Cost Funds Dupe Investors”, the fund industry offers many cheap funds but very few funds with high-quality stocks, or with what I call good portfolio management.
Investors need to tread carefully when considering All Cap Blend ETFs and mutual funds, as just a few receive above a Dangerous rating. No ETFs or mutual funds in the All Cap Blend style allocate enough value to Attractive-or-better-rated stocks to earn an Attractive rating. Investors should focus on individual stocks instead.
Western Digital (WDC) is one of my favorite stocks held by All Cap Blend ETFs and mutual funds and earns my Very Attractive rating. WDC has grown profits (NOPAT) by an impressive 41% compounded annually since 2002 and has a return on invested capital (ROIC) of 24%, which is in the top quintile of all companies I cover. WDC has also earned positive economic earnings every year since the company became profitable in 2002 and has a free cash flow yield of 15%.
I wrote back in June that WDC had more upside even after a 112% increase. The stock is up another 34% since then, but WDC still has value left to investors. At its current valuation of ~$85/share, WDC has a price to economic book value (PEBV) ratio of 1.0.This ratio implies that the market expects WDC to never grow its profits from the current level. WDC’s consistently high ROIC and past profit growth suggests that the company has plenty of growth potential in the future. Investors should pick up shares of WDC before the market readjusts its expectations, and those who already hold the stock shouldn’t start taking profits yet.
Regions Financial Corp. (RF) is one of my least favorite stocks held by All Cap Blend ETFs and mutual funds and earns my Dangerous rating. Regions’ profits (NOPAT) have declined by 10% compounded annually since 2004. Over this time, the company’s NOPAT margins have fallen from 30% to 9%. In addition, RF’s return on invested capital (ROIC) is just 2%, which puts it in the bottom quintile of all companies I cover. The company has also never earned positive economic earnings going back to 1998. While other banks have succeeded in growing despite the financial crisis, RF has not. Yet the stock is still overvalued at ~$11/share. To justify this stock price, RF would need to grow NOPAT by 18% compounded annually for the next 13 years. Regions’ inability to grow its profits from their levels 10 years ago does not make me confident that the company will be able to grow into its valuation. Investors should avoid RF at this price.
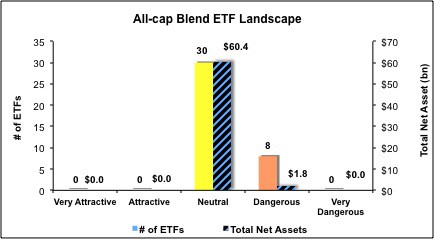
Figures 4 and 5 show the rating landscape of all All Cap Blend ETFs and mutual funds.
My Style Rankings for ETFs and Mutual Funds report ranks all styles and highlights those that offer the best investments.
Figure 4: Separating the Best ETFs From the Worst Funds
 Sources: New Constructs, LLC and company filings
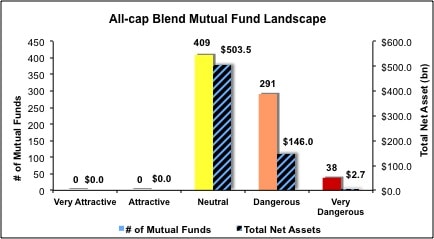
Figure 5: Separating the Best Mutual Funds From the Worst Funds
 Sources: New Constructs, LLC and company filings
Review my full list of ratings and rankings along with reports on all 38 ETFs and 738 mutual funds in the All Cap Blend style.
André Rouillard contributed to this report.
Disclosure: David Trainer and André Rouillard receive no compensation to write about any specific stock, sector, style or theme.