
The Large Cap Value style ranks third out of the twelve fund styles as detailed in my Style Rankings for ETFs and Mutual Funds report. It gets my Neutral rating, which is based on aggregation of ratings of 49 ETFs and 807 mutual funds in the Large Cap Value style as of January 28, 2014. Prior reports on the best & worst ETFs and mutual funds in every sector and style are here.
Figures 1 and 2 show the five best and worst-rated ETFs and mutual funds in the style. Not all Large Cap Value style ETFs and mutual funds are created the same. The number of holdings varies widely (from 18 to 1413), which creates drastically different investment implications and ratings. The best ETFs and mutual funds allocate more value to Attractive-or-better-rated stocks than the worst, which allocate too much value to Neutral-or-worse-rated stocks.
To identify the best and avoid the worst ETFs and mutual funds within the Large Cap Value style, investors need a predictive rating based on (1) stocks ratings of the holdings and (2) the all-in expenses of each ETF and mutual fund. Investors need not rely on backward-looking ratings. My fund rating methodology is detailed here.
<Investors should not buy any Large Cap Value ETFs or mutual funds because none get an Attractive-or-better rating. If you must have exposure to this style, you should buy a basket of Attractive-or-better rated stocks and avoid paying undeserved fund fees. Active management has a long history of not paying off.
Get my ratings on all ETFs and mutual funds in this style by searching for Large Cap Value on my free mutual fund and ETF screener.
Figure 1: ETFs with the Best & Worst Ratings – Top 5
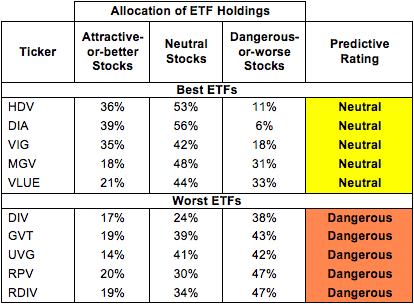 * Best ETFs exclude ETFs with TNAs less than $100 million for inadequate liquidity.
Sources: New Constructs, LLC and company filings
Six ETFs are excluded from Figure 1 because their total net assets (TNA) are below $100 million and do not meet our liquidity standards. The excluded ETFs can be found here.
Figure 2: Mutual Funds with the Best & Worst Ratings – Top 5
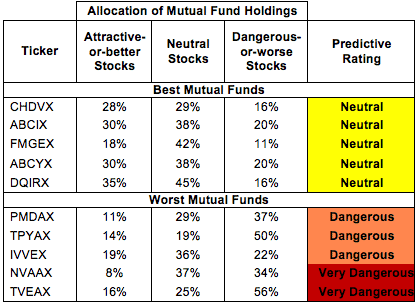 * Best mutual funds exclude funds with TNAs less than $100 million for inadequate liquidity.
Sources: New Constructs, LLC and company filings
iShares High Dividend ETF (HDV) is my top-rated Large Cap Value ETF and Cullen Funds Trust: Cullen High Dividend Equity Fund (CHDVX) is my top-rated Large Cap Value mutual fund. Both earn my Neutral rating.
RevenueShares Ultra Dividend Fund (RDIV) is my worst-rated Large Cap Value ETF and Transparent Value Trust: Transparent Value Dividend Fund (TVEAX) is my worst-rated Large Cap Value mutual fund. RDIV earns my Dangerous rating and TVEAX earns my Very Dangerous rating.
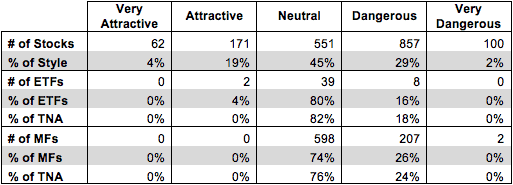
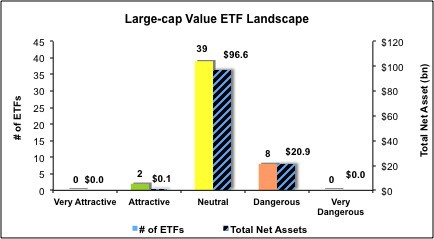
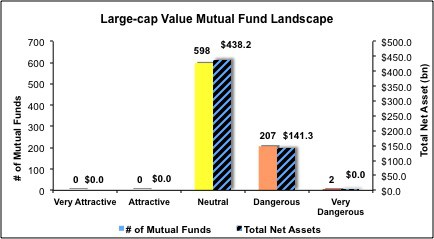
Figure 3 shows that 233 out of the 1741 stocks (over 24% of the market value) in Large Cap Value ETFs and mutual funds get an Attractive-or-better rating. However, only 2 out of 49 Large Cap Value ETFs (less than 1% of total net assets) and 0 out of 807 Large Cap Value mutual funds (get an Attractive-or-better rating.
The takeaways are: mutual fund managers allocate too much capital to low-quality stocks and Large Cap Value ETFs hold poor quality stocks.
Figure 3: Large Cap Value Style Landscape For ETFs, Mutual Funds & Stocks
 Sources: New Constructs, LLC and company filings
As detailed in “Low-Cost Funds Dupe Investors”, the fund industry offers many cheap funds but very few funds with high-quality stocks, or with what I call good portfolio management.
Investors need to tread carefully when considering Large Cap Value ETFs and mutual funds, as many of them receive my Dangerous rating, and none receive my Attractive-or-better rating. Only 2 ETFs and 0 mutual funds in the Large Cap Value style allocate enough value to Attractive-or-better-rated stocks to earn an Attractive rating. Investors looking for exposure to this style would be better suited to focus on individual stocks instead.
Altria Group, Inc. (MO) is one of my favorite stocks held Large Cap Value ETFs and mutual funds and earns my Very Attractive rating. Over the past 5 years, MO has increased after tax profits (NOPAT) by 10% compounded annually. MO currently earns a top quintile return on invested capital (ROIC) of 18%. Despite this steady growth and excellent ROIC, MO is still undervalued. At ~$37/share, MO has a price to economic book value (PEBV) ratio of 0.9. This ratio implies that MO’s NOPAT will permanently decline by 10%. Consistent growth and low market expectations create a good investment opportunity in MO.
Senior Housing Properties Trust (SNH) is one of my least favorite stocks held by TVEAX and earns my Very Dangerous rating. Over the past 12 years, SNH’s return on invested capital (ROIC) has decreased from ~14% to ~6%. During this time, SNH has never generated positive economic earnings. SNH’s stock price has decreased 8% over the past year, but I believe it is still overvalued. To justify the current valuation of ~$22/share, SNH would have to grow NOPAT by 12% compounded annually for the next decade. While this may be possible given past growth, they would also have to improve ROIC to 8%, a level not achieved since 2000. To own SNH, one must think they can grow quickly for a long time while also increasing ROIC. Few companies have ever performed so well. Betting on SNH to beat the market’s expectations for future performance is like betting on Marshawn Lynch to throw more touchdown passes than Peyton Manning in the Super Bowl. It is possible, I guess, but not likely.
Figures 4 and 5 show the rating landscape of all Large Cap Value ETFs and mutual funds.
My Style Rankings for ETFs and Mutual Funds report ranks all styles and highlights those that offer the best investments.
Figure 4: Separating the Best ETFs From the Worst Funds
 Sources: New Constructs, LLC and company filings
Figure 5: Separating the Best Mutual Funds From the Worst Funds
 Sources: New Constructs, LLC and company filings
Review my full list of ratings and rankings along with reports on all 49 ETFs and 807 mutual funds in the Large Cap Value style.
Kyle Guske II contributed to this report.
Disclosure: David Trainer owns MO. David Trainer and Kyle Guske II receive no compensation to write about any specific stock, sector, style or theme.