
The Mid Cap Blend style ranks seventh out of the twelve fund styles as detailed in my Style Rankings for ETFs and Mutual Funds report. It gets my Dangerous rating, which is based on aggregation of ratings of 16 ETFs and 336 mutual funds in the Mid Cap Blend style as of January 28, 2014. Prior reports on the best & worst ETFs and mutual funds in every sector and style are here.
Figures 1 and 2 show the five best and worst-rated ETFs and mutual funds in the style. Not all Mid Cap Blend style ETFs and mutual funds are created the same. The number of holdings varies widely (from 23 to 3036), which creates drastically different investment implications and ratings. The best ETFs and mutual funds allocate more value to Attractive-or-better-rated stocks than the worst, which allocate too much value to Neutral-or-worse-rated stocks.
To identify the best and avoid the worst ETFs and mutual funds within the Mid Cap Blend style, investors need a predictive rating based on (1) stocks ratings of the holdings and (2) the all-in expenses of each ETF and mutual fund. Investors need not rely on backward-looking ratings. My fund rating methodology is detailed here.
Investors should not buy any Mid Cap Blend ETFs or mutual funds because none get an Attractive-or-better rating. If you must have exposure to this style, you should buy a basket of Attractive-or-better rated stocks and avoid paying undeserved fund fees. Active management has a long history of not paying off.
Get my ratings on all ETFs and mutual funds in this style by searching for Mid Cap Blend on my free mutual fund and ETF screener.
Figure 1: ETFs with the Best & Worst Ratings – Top 5
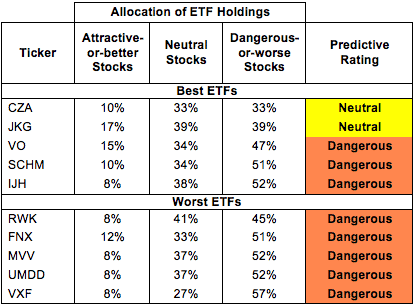 * Best ETFs exclude ETFs with TNAs less than $100 million for inadequate liquidity.
Sources: New Constructs, LLC and company filings
PowerShares RAFI Fundamental Pure Mid Core Portfolio (PXMC), PowerShares S&P MidCap Low Volatility Portfolio (XMLV), and Guggenheim Russell Midcap Equal Weight ETF (EWRM) are excluded from Figure 1 because their total net assets (TNA) are below $100 million and do not meet our liquidity standards
Figure 2: Mutual Funds with the Best & Worst Ratings – Top 5
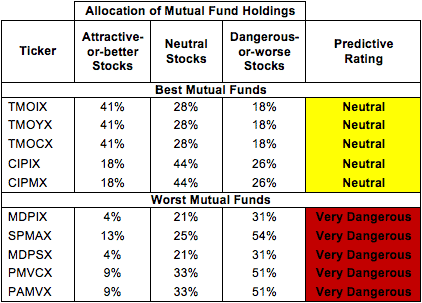 * Best mutual funds exclude funds with TNAs less than $100 million for inadequate liquidity.
Sources: New Constructs, LLC and company filings
Four funds are excluded from Figure 2 because their total net assets (TNA) are below $100 million and do not meet our liquidity standards.
Guggenheim Mid-Cap Core ETF (CZA) is my top-rated Mid Cap Blend ETF and Touchstone Strategic Trust: Touchstone Mid Cap Value Opportunities Fund (TMOIX) is my top-rated Mid Cap Blend mutual fund. Both earn my Neutral rating.
Vanguard Extended Market ETF (VXF) is my worst-rated Mid Cap Blend ETF and Pacific Advisors Fund Inc: Mid Cap Value Fund (PAMVX) is my worst-rated Mid Cap Blend mutual fund. VXF earns my Dangerous rating and PAMVX earns my Very Dangerous rating.
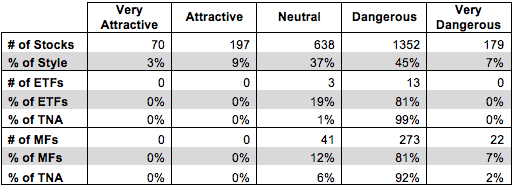
Figure 3 shows that 267 out of the 2436 stocks (over 12% of the market value) in Mid Cap Blend ETFs and mutual funds get an Attractive-or-better rating. However, 0 out of 16 Mid Cap Blend ETFs and 0 out of 336 Mid Cap Blend mutual funds get an Attractive-or-better rating.
The takeaways are: mutual fund managers allocate too much capital to low-quality stocks and Mid Cap Blend ETFs hold poor quality stocks.
Figure 3: Mid Cap Blend Style Landscape For ETFs, Mutual Funds & Stocks
 Sources: New Constructs, LLC and company filings
As detailed in “Low-Cost Funds Dupe Investors”, the fund industry offers many cheap funds but very few funds with high-quality stocks, or with what I call good portfolio management.
Investors need to tread carefully when considering Mid Cap Blend ETFs and mutual funds, as this style is filled with Dangerous and Very Dangerous rated ETFs and mutual funds. No ETFs or mutual funds in the Mid Cap Blend style allocate enough value to Attractive-or-better-rated stocks to earn an Attractive rating. Investors should focus on individual stocks instead.
Zimmer Holdings, Inc. (ZMH) is one of my favorite stocks held by Mid Cap Blend ETFs and mutual funds and earns my Attractive rating. Over the past 11 years, ZMH has grown after-tax profits (NOPAT) by 20% compounded annually and the company earns a top quintile return on invested capital (ROIC) of 15%. ZMH has also generated positive economic earnings for the past 11 years. At its current valuation of ~$93/share, ZMH has a price to economic book value (PEBV) ratio of 1.2. This ratio implies that the market expects ZMH to grow its NOPAT by no more than 20% for the rest of its life as a company. After over a decade of growing at that very rate, ZMH should be able to exceed the market’s expectations. The company is not in the deep value bin, but with its strong track record of growth it still has plenty of upside.
Navistar International Corp (NAV) is one of my least favorite stocks held by Mid Cap Blend ETFs and mutual funds and earns my Dangerous rating. Since 2008, NAV’s after-tax profit (NOPAT) has decreased from $800 million to its current 2013 level of -$405 million. At the same time, the company’s return on invested capital (ROIC) has declined from 18% to -7%. As I wrote earlier this month, those who pin their investment hopes on a further turnaround for NAV underestimate just how much profit growth is already priced into the stock. To justify its current valuation of ~$33/share, NAV would have to achieve positive margins and grow revenue by 10% compounded annually for the next 36 years. Those expectations make the stock look awfully expensive given that NAV’s revenues have declined by 6% compounded annually for the last 5 years. Even if NAV can recover from its recent struggles, to sustain 10% growth for such an extended period of time seems unrealistic. NAV’s current valuation has priced out any potential upside and investors should steer clear.
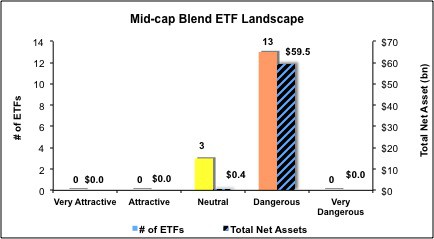
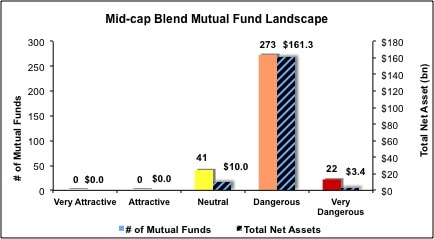
Figures 4 and 5 show the rating landscape of all Mid Cap Blend ETFs and mutual funds.
My Style Rankings for ETFs and Mutual Funds report ranks all styles and highlights those that offer the best investments.
Figure 4: Separating the Best ETFs From the Worst Funds
 Sources: New Constructs, LLC and company filings
Figure 5: Separating the Best Mutual Funds From the Worst Funds
 Sources: New Constructs, LLC and company filings
Review my full list of ratings and rankings along with reports on all 16 ETFs and 336 mutual funds in the Mid Cap Blend style.
Kyle Guske II contributed to this report.
Disclosure: David Trainer and Kyle Guske II receive no compensation to write about any specific stock, sector, style or theme.