
The Mid Cap Growth style ranks eighth out of the twelve fund styles as detailed in my Style Rankings for ETFs and Mutual Funds report. It gets my Dangerous rating, which is based on aggregation of ratings of 10 ETFs and 356 mutual funds in the Mid Cap Growth style as of January 29, 2014. Prior reports on the best & worst ETFs and mutual funds in every sector and style are here.
Figure 1 ranks from best to worst the eight mid-cap growth ETFs that meet our liquidity standards and Figure 2 shows the five best and worst-rated mid-cap growth mutual funds. Not all Mid Cap Growth style ETFs and mutual funds are created the same. The number of holdings varies widely (from 24 to 567), which creates drastically different investment implications and ratings. The best ETFs and mutual funds allocate more value to Attractive-or-better-rated stocks than the worst, which allocate too much value to Neutral-or-worse-rated stocks.
To identify the best and avoid the worst ETFs and mutual funds within the Mid Cap Growth style, investors need a predictive rating based on (1) stocks ratings of the holdings and (2) the all-in expenses of each ETF and mutual fund. Investors need not rely on backward-looking ratings. My fund rating methodology is detailed here.
Investors should not buy any Mid Cap Growth ETFs or mutual funds because none get an Attractive-or-better rating. If you must have exposure to this style, you should buy a basket of Attractive-or-better rated stocks and avoid paying undeserved fund fees. Active management has a long history of not paying off.
Get my ratings on all ETFs and mutual funds in this style by searching for Mid Cap Growth on my free mutual fund and ETF screener.
Figure 1: ETFs with the Best & Worst Ratings
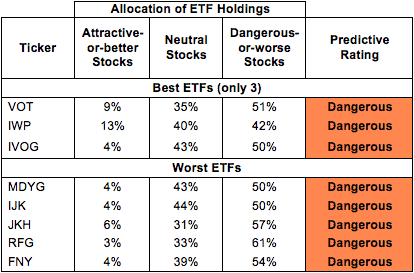 * Best ETFs exclude ETFs with TNAs less than $100 million for inadequate liquidity.
Sources: New Constructs, LLC and company filings
PowerShares RAFI Fundamental Pure Mid Growth Portfolio (PXMG) and ProShares Ultra Russell MidCap Growth (UKW) are excluded from Figure 1 because their total net assets (TNA) are below $100 million and do not meet our liquidity standards.
Figure 2: Mutual Funds with the Best & Worst Ratings – Top 5
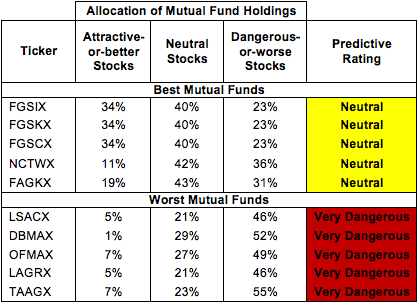 * Best mutual funds exclude funds with TNAs less than $100 million for inadequate liquidity.
Sources: New Constructs, LLC and company filings
Vanguard Mid-Cap Growth ETF (VOT) is my top-rated Mid Cap Growth ETF and Federated Equity Funds: Federated MDT Mid Cap Growth Strategies Fund (FGSIX) is my top-rated Mid Cap Growth mutual fund. VOT earns my Dangerous rating and FGSIX earns my Neutral rating.
First Trust Mid Cap Growth AlphaDEX Fund (FNY) is my worst-rated Mid Cap Growth ETF and Timothy Plan: Timothy Plan Aggressive Growth Fund (TAAGX) is my worst-rated Mid Cap Growth mutual fund. FNY earns my Dangerous rating and TAAGX earns my Very Dangerous rating.
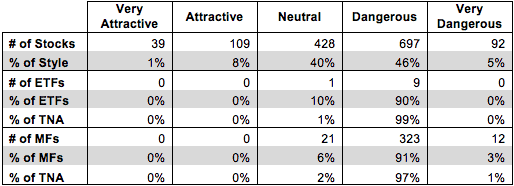
Figure 3 shows that 148 out of the 1365 stocks (over 9% of the market value) in Mid Cap Growth ETFs and mutual funds get an Attractive-or-better rating. However, 0 out of 10 Mid Cap Growth ETFs and 0 out of 356 Mid Cap Growth mutual funds get an Attractive-or-better rating.
The takeaways are: mutual fund managers allocate too much capital to low-quality stocks and Mid Cap Growth ETFs hold poor quality stocks.
Figure 3: Mid Cap Growth Style Landscape For ETFs, Mutual Funds & Stocks
 Sources: New Constructs, LLC and company filings
As detailed in “Low-Cost Funds Dupe Investors”, the fund industry offers many cheap funds but very few funds with high-quality stocks, or with what I call good portfolio management.
Investors need to tread carefully when considering Mid Cap Growth ETFs and mutual funds, as there are so many Dangerous-or-worse rated funds. No ETFs or mutual funds in the Mid Cap Growth style allocate enough value to Attractive-or-better-rated stocks to earn an Attractive rating. For exposure to this style, investors should focus on individual stocks instead.
Western Digital Corp (WDC) is one of my favorite stocks held by FGSIX and earns my Very Attractive rating. WDC has grown after-tax profit (NOPAT) by 27% compounded annually for the past decade. The company earns a top-quintile return on invested capital (ROIC) of 24%. Also, WDC has generated positive economic earnings for the past 12 years. Despite this impressive history of growth by WDC, I believe they are still undervalued. As I noted back in July of 2013, WDC has more upside, and while the stock is up 32% since my article, there is still value to be had. At the current valuation of ~$84/share, WDC has a price to economic book value (PEBV) ratio of 0.9. This ratio implies that the market expects WDC’s NOPAT to permanently decline by 10%. With a profit growth history that is top of the heap and continued low expectations, WDC certainly has the potential to climb even higher.
Group 1 Automotive, Inc. (GPI) is one of my least favorite stocks held by TAAGX and earns my Dangerous rating. Over the past seven years, GPI has only grown after-tax profits (NOPAT) by 3% compounded annually and has a return on invested capital (ROIC) of just 5%. GPI has also generated negative economic earnings for the past 12 years. Despite this anemic growth, GPI still remains overvalued. To justify its current valuation of ~$61/share GPI would have to grow NOPAT by 8% compounded annually for the next 15 years. One must be overly optimistic to believe GPI could more than double their past yearly NOPAT growth as well as sustain those levels for such an extended period of time. The performance expectations embedded into the current valuation just aren’t realistic and investors should steer clear of GPI.
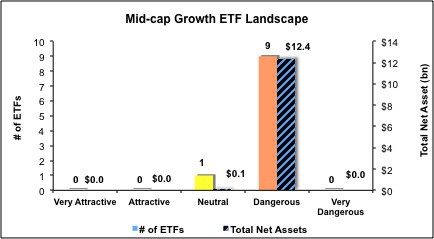
Figures 4 and 5 show the rating landscape of all Mid Cap Growth ETFs and mutual funds.
My Style Rankings for ETFs and Mutual Funds report ranks all styles and highlights those that offer the best investments.
Figure 4: Separating the Best ETFs From the Worst Funds
 Sources: New Constructs, LLC and company filings
Figure 5: Separating the Best Mutual Funds From the Worst Funds
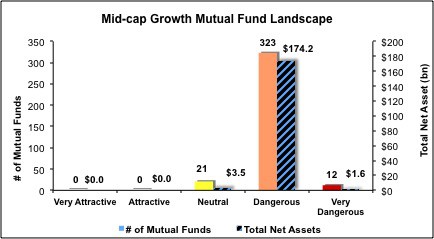 Sources: New Constructs, LLC and company filings
Review my full list of ratings and rankings along with reports on all 10 ETFs and 356 mutual funds in the Mid Cap Growth style.
Kyle Guske II contributed to this report.
Disclosure: David Trainer and Kyle Guske II receive no compensation to write about any specific stock, sector, style or theme.