
As I wrote earlier this year, I’m long-term bullish on this market, but stretched valuations in certain parts of the market, like cloud stocks and social media stocks, are at major risk of blowing up. With many momentum stocks appearing to peter out, investors could do a lot worse than investing in a blue chip stock like Johnson & Johnson (JNJ: ~$98/share) when it’s valued at such a cheap price.
Diversification Leads to Consistent Profits
JNJ sells a massive variety of products from Band-Aids and Tylenol to joint reconstruction products. This diversification gives JNJ’s profits a greater consistency than other companies. When one product struggles, it has others to make up the difference. This consistency explains why JNJ has grown after-tax profit (NOPAT) by 10% compounded annually for the past 15 years. Its NOPAT has not declined in any year over that timeframe.
The diversification of JNJ’s revenue streams is truly impressive. JNJ operates in three segments, Consumer, Pharmaceutical, and Medical Devices. Medical Devices is the largest segment with $28.5 billion in sales (40% of revenues). The largest product within Medical Devices, Orthopaedics, makes up only $9.5 billion, or 13% of total revenues. It also happens to be one of JNJ’s fastest growing product groups, with 22% revenue growth in 2013.
JNJ’s diversified product portfolio gives it a leg up on its competitors, which we can see through its superior return on invested capital (ROIC). JNJ’s ROIC of 15% is higher than competitors like Bristol-Myers Squibb (BMY) at 10%, Pfizer (PFE) at 5%, or Medtronic (MDT) at 13%.
Reported Earnings Understate Profits
People who read my research regularly know that reported earnings are not a good indicator of the core operating profitability of a business. GAAP rules were designed for debt investors, not equity investors, and often include unusual or non-operating items that obscure the true profitability of a company. We’ve made over 57,000 adjustments to reported income statements and balance sheet based on annual reports filed in the last two months. These adjustments are necessary to analyze a company’s true economic earnings.
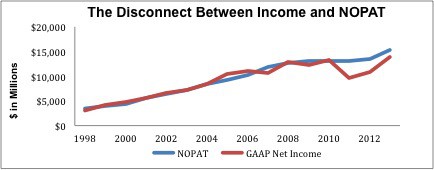
Figure 1 shows how, in the past two years, JNJ’s reported income has understated its NOPAT, whereas for the rest of its history NOPAT and GAAP net income have been nearly identical. For most companies, NOPAT is regularly higher than net income since it excludes interest expense, but since JNJ has such a large cash pile compared to its debt, interest income and interest expense nearly cancel out. In a regular year, JNJ’s income and NOPAT would be similar, but unusual expenses have artificially depressed JNJ’s accounting earnings.
Figure 1: GAAP vs NOPAT
 Sources: New Constructs, LLC and company filings
Two major unusual items accounted for this disconnect in 2013. One was a $600 million impairment charge related to in-process research and development. The other charge was $2.5 billion for “Other (Income) Expense”, which consisted primarily of litigation expenses. While one doesn’t like to see write-downs and lawsuits, they are unavoidable for a health care company of JNJ’s size.
In fact JNJ compares favorably to its competitors when we look at these expenses. JNJ has accumulated asset write-downs equivalent to 6% of net assets, which is below Bristol Myers (BMY) 23%, Medtronic’s 7%, or Pfizer’s 16%.
Looking back over JNJ’s history, we can see significant fluctuation in these charges, and see that both were on the high end in 2013 for JNJ. Over the past 10 years, JNJ’s in-process research and development charge has averaged ~$370 million per year, while its “Other (Income) Expense” has only been ~$420 million a year. Investors who look just at reported earnings for JNJ miss the fact that expenses are inflated by these unusually high charges.
Strong Growth Opportunities
The world is getting older, not just in the U.S., but also internationally, where JNJ earns 55% of its revenue. An aging population means greater spending on health care, and we can already see the benefit for JNJ with the growth of its orthopaedics products and the 11% sales growth last year in its Pharmaceutical segment.
Even better, JNJ has a strong pipeline of new products that it’s rolling out, both in the Pharmaceuticals and Medical Devices segments. In Pharmaceuticals, the European Medicines Agency has recommended granting marketing authorization for Vokanamet, JNJ’s Type 2 diabetes treatment, and in Medical Devices, the FDA approved JNJ’s SmartTouch Catheter, which is used for patients with heart rhythm disorders.
These products are just the tip of the iceberg. JNJ is also using its significant resources to invest in smaller biotech companies, like Alector, a startup trying to develop new therapies for Alzheimer’s. Getting drugs successfully through the approval process and to the market can be a bit of a lottery sometimes, and with its strong cash flow and significant cash on the balance sheet, JNJ can afford to buy more tickets than almost anyone else.
In the Consumer segment, JNJ’s brands give it a fairly wide moat. Familiarity is important for over the counter medicines, skin care products, and nutritional products that consumers are going to be putting into their body. JNJ has some of the best brand awareness in the business, with some of its brands, like Band-Aid, Listerine, and Neosporin, becoming synonymous with the product itself. These basic consumer products are resistant to economic setbacks and should continue to deliver steady, if modest, growth.
Cheap Valuation
The biggest knock on JNJ from investors is its valuation, which the market perceives to be on the high end. Investors will point to its P/E of 19, which is higher than PFE at 15 or MDT at 17, as a reason not to buy the stock. However, the simple P/E ratio misses a great deal and understates the value in JNJ.
First of all, as I mentioned above, the earnings side of P/E was distorted in 2013 by unusual costs. While reported earnings were $13.8 billion, JNJ actually earned a NOPAT of $15.3 billion. I’m reminded of my interview with former FASB chairman Robert Herz from last May. When I asked him what he thought about the focus on accounting earnings in the market, he replied,
“I’m not a big fan of earnings multiples, of P/E multiples and things like that. We have made over time dramatic changes in the accounting that affect the denominator of the P/E ratio, but it’s not clear whether and how that flows through the valuations.”
In addition to the issues with JNJ’s accounting earnings, P/E also ignores another significant aspect of shareholder value, the balance sheet. JNJ’s $28 billion in excess cash more than covers its debt and pension liabilities. This cash represents potential shareholder value, either through stock buybacks or investment in new growth opportunities. The $4.2 billion sale of its diagnostics unit, which has been in decline, will give JNJ even more cash to work with.
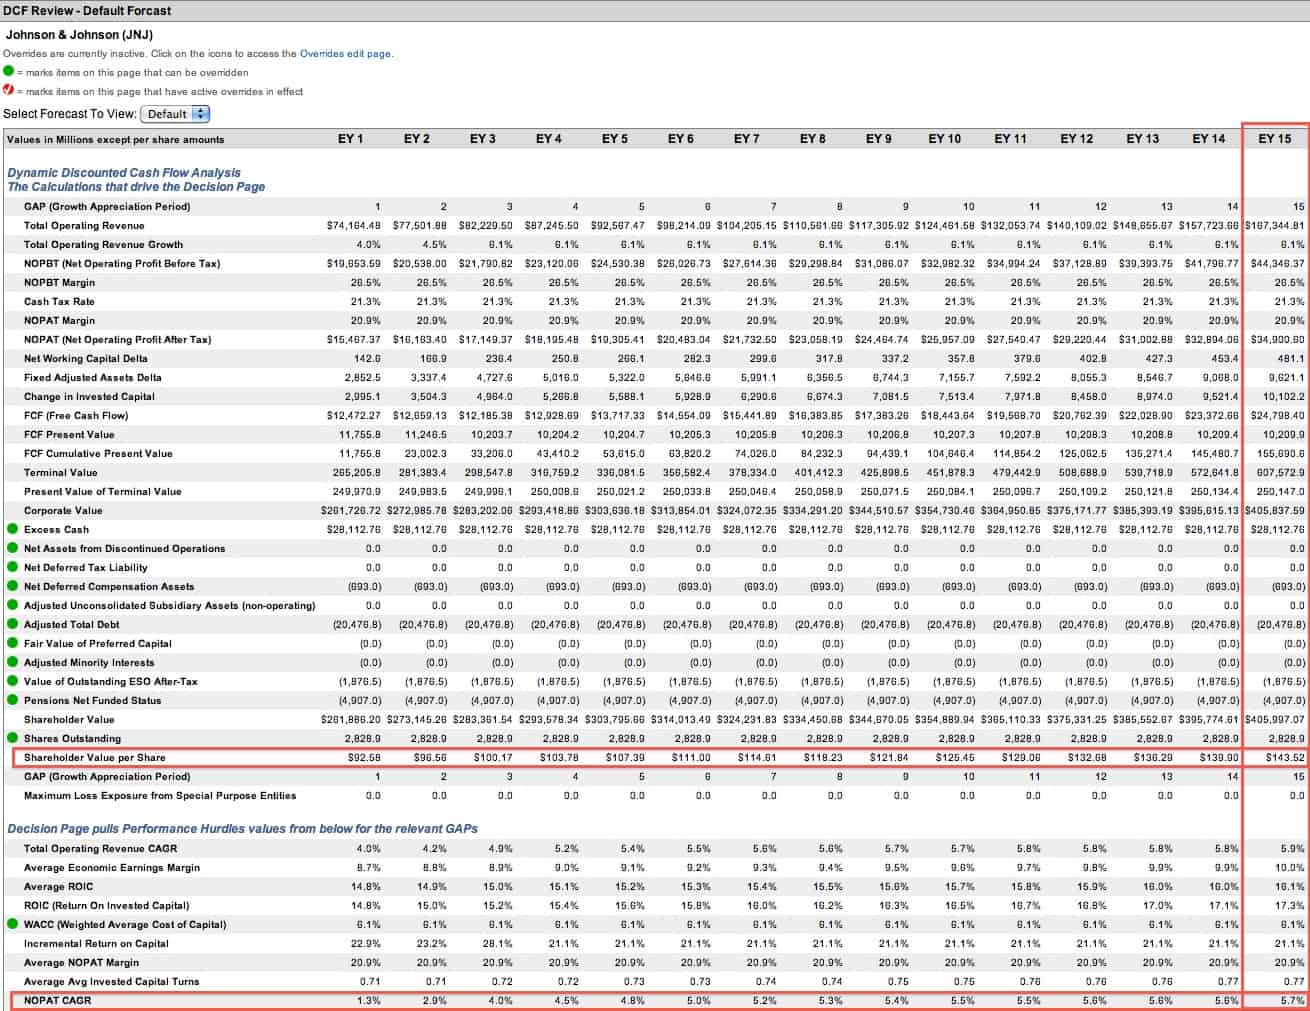
Our calculation of price to economic book value (PEBV) captures all these factors by comparing the company’s stock price to the perpetuity value of the current cash flows (NOPAT) of the business assuming zero growth. What we find is that JNJ has a PEBV of 1.1, which implies that the company will only grow NOPAT by 10% for the remainder of its corporate life. Remember, this is a company that has grown NOPAT by 10% compounded annually for the fifteen years that my model covers.
Even with relatively modest growth, JNJ has significant potential upside. If the company can grow NOPAT by just 6% compounded annually for the next 15 years, the stock has a fair value of ~$145/share, a 50% premium to its current valuation of ~$98/share.
JNJ is not a get rich quick stock that will double within a year, but it is a safe investment with limited downside risk and significant upside potential. A safe investment like JNJ could benefit a lot of investors in such a risky market.
Look for JNJ to beat earnings expectations in the next couple of quarters as reported earnings catch up to economic earnings. Growth expectations are fairly muted, which gives significant opportunity for the stock to go up on positive results.
Also, further volatility like the market experienced last week could send investors running from risky, overvalued, momentum-driven stocks and into steady dividend payers like JNJ. JNJ’s fundamentals actually support a higher valuation, and I expect that quality is one that will become more attractive to investors no matter the market environment.
Good Funds With Exposure to JNJ
The following ETFs and mutual funds allocate heavily to JNJ and earn an Attractive rating:
- GMO Trust: GMO Quality Fund (GQLOX): 5.4% allocation to JNJ.
- Advisers Investment Trust: Independent Franchise Partners US Equity Fund (IFPUX): 4.6% allocation to JNJ.
- Schwab US Dividend Equity ETF (SCHD): 4.4% allocation to JNJ.
- BlackRock Funds: BlackRock Exchange Portfolio (STSEX): 4.1% allocation to JNJ.
- Manning & Napier Fund: Dividend Focus Series (MDFSX): 4.0% allocation to JNJ.
- Dreyfus Appreciation Fund (DGYGX): 3.3% allocation to JNJ.
Sam McBride contributed to this report
Disclosure: David Trainer and Sam McBride receive no compensation to write about any specific stock, sector, or theme.