This report focuses on my top picks and pans for all sector funds. I will follow this summary with a detailed report on each sector.
My top ETFs and mutual funds have high-quality holdings and low costs. As detailed in “Low-cost funds dupe investors” there are few funds that have both good holdings and low costs. While there are lots of cheap funds, there are very few with high-quality holdings.
I think there are at least two causes for this disconnect. First, there is, in general, a lack of independent research on ETFs and funds. Second, I think it is fair to say that there is a severe lack of quality research into the holdings of mutual funds and ETFs. There should not be such a large gap between the quality of research on stocks and funds, which are simply groups of stocks.
After all, investors should care more about the quality of a fund’s holdings than its costs because the quality of a fund’s holdings is the single most important factor in determining its future performance.
My Predictive Rating system rates 7400+ ETFs and mutual funds according to the quality of their holdings (Portfolio Management Rating) and their costs (Total Annual Costs Rating).
Figure 1 shows the best ETF or mutual fund in each investment sector as of April 2, 2014.
For a full list of all ETFs and mutual funds for each investment sector ranked from best to worst, see our ETF and mutual fund screener.
Figure 1: Best ETFs and Mutual Funds In Each Sector
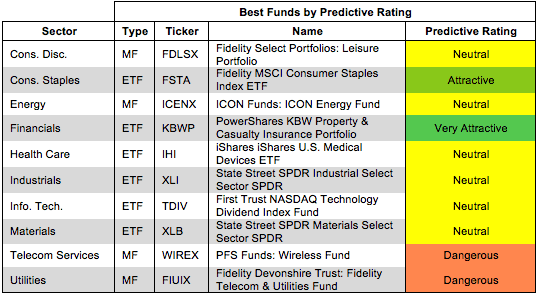 Source: New Constructs, LLC and company filings
PowerShares KBW Property & Casualty Insurance Portfolio (KBWP) is my overall highest-rated ETF and earns my Very Attractive rating. KBWP allocates over 90% of its assets to Attractive-or-better rated stocks and has low annual costs of only 0.39%.
The Allstate Corp (ALL) is one of my favorite stocks held by KBWP and earns my Very Attractive rating. Since the financial crisis of 2008, ALL has grown after-tax profit (NOPAT) by 32% compounded annually and increased their return on invested capital (ROIC) from 6% to 14%. ALL recently completed the sale of Lincoln Benefit Life Company, which will reduce its exposure to interest rates and spread based businesses as well as strengthen its balance sheet.
Despite the positive growth of ALL, the market expectations are not so positive. At the current price of ~$57/share, ALL has a price to economic book value (PEBV) ratio of 0.7. This ratio implies the market expects a permanent 30% decline in NOPAT for the insurance provider. ALL is not going to continue growing as fast as it has in recent years, but such a sharp decline seems unlikely. Investors should take advantage of these low market expectations and buy the stock.
Figure 2 shows the worst ETF or mutual fund for each sector as of April 2, 2014.
Dangerous-or-worse-rated funds have a combination of low-quality portfolios (i.e. they hold too many Dangerous-or-worse rated stocks) and high costs (they charge investors too much for the [lack of] management they provide).
Figure 2: Worst ETFs and Mutual Funds In Each Sector
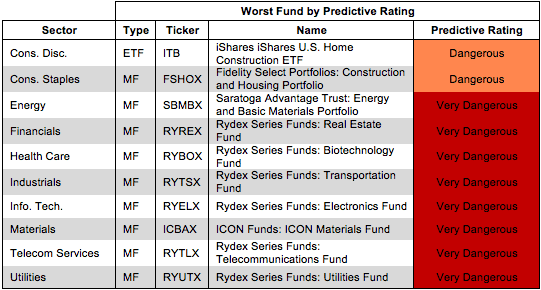 Source: New Constructs, LLC and company filings
ICON Funds: ICON Materials Fund (ICBAX) is my worst rated Materials mutual fund and earns my Very Dangerous rating. ICBAX allocates over 81% of its assets to Neutral-or-worse rated stocks, all while charging investors 4.31% in total annual costs.
The Dow Chemical Company (DOW) is one of my least favorite companies held by ICBAX and earns my Very Dangerous rating. Over the last eight years, DOW has seen after-tax profit (NOPAT) decline by 3% compounded annually. Over this time, its return on invested capital (ROIC) has dropped from 13% to 6%. However, the market has looked past this lack of growth and declining profitablity as it currenty gives DOW a premium valuation. In order to justify its current valuation of ~$50/share, DOW would need to grow NOPAT by 10% compounded annually for the next 24 years. 10% NOPAT growth over the next quarter century for a company that hasn’t increased NOPAT over the last seven years seems highly unlikely. Investors should avoid DOW.
Traditional mutual fund research has focused on past performance and low management costs. The quality of a fund’s holdings has been ignored. Our portfolio management rating examines the fund’s holdings in detail and takes into account the fund’s allocation to cash. Our models are created with data from over 40,000 annual reports. This kind of diligence is necessary for understanding just what you are buying when you invest in a mutual fund or an ETF.
Figure 3 shows the best fund based on our Portfolio Management Rating for each sector as of April 2, 2014.
Attractive-or-better-rated funds own high-quality stocks and hold very little of the fund’s assets in cash – investors looking to hold cash can do so themselves without paying management fees. Less than 1% of funds receive our Attractive or Very Attractive ratings, so investors need to be cautious when selecting a mutual fund or ETF – there are thousands of Neutral-or-worse-rated funds.
Figure 3: Sector Funds With Highest Quality Holdings
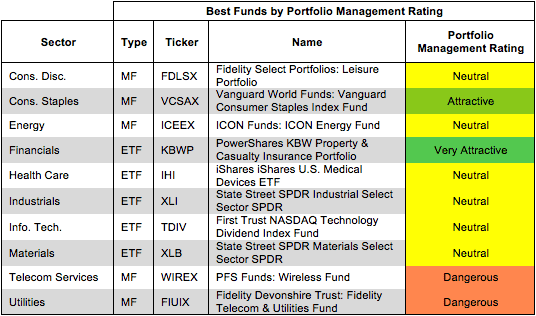 Source: New Constructs, LLC and company filings
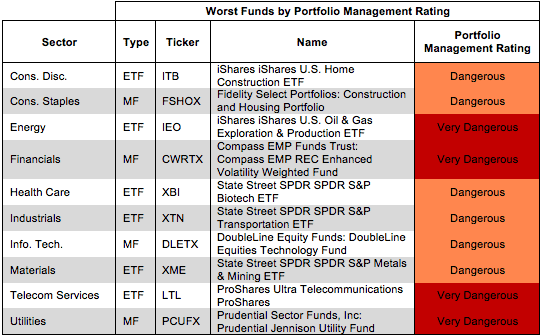
Figure 4 shows the worst fund based on our Portfolio Management Rating for each sector as of April 2, 2014.
Investors pay mutual fund managers to pick stocks for them. Even ignoring costs, these mutual fund managers do a poor job investing money for their clients.
Figure 4: Sector Funds With Lowest Quality Holdings
 Source: New Constructs, LLC and company filings
Investors should care about all of the fees associated with a fund in addition to the quality of the fund’s holdings. The best funds have both low costs and quality holdings – and there are plenty of low cost funds available to investors.
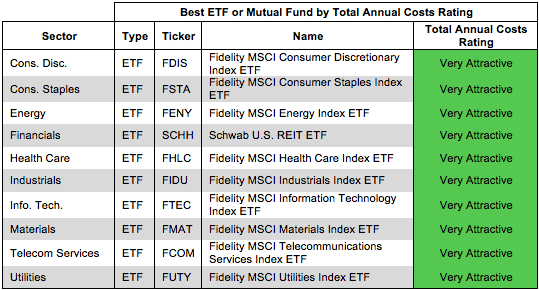
Figure 5 shows the best fund in each sector according to our total annual costs rating. An ETF ranks as the lowest cost for seven of the twelve sector categories.
Total Annual Costs incorporates all expenses, loads, fees, and transaction costs into a single value that is comparable across all funds. Passively managed ETFs and index mutual funds are generally the cheapest funds.
Figure 5: Sector Funds With Lowest Costs
 Source: New Constructs, LLC and company filings
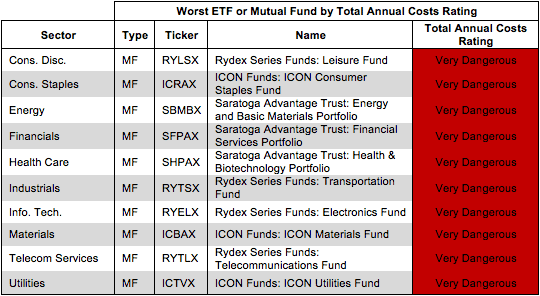
The most expensive fund for each sector has a Very Dangerous Total Annual Costs Rating. Investors should avoid these funds and other funds with a Very Dangerous Total Annual Costs Ratings because they charge investors too much. For every fund with a Very Dangerous Total Annual Costs Rating there is an alternative fund that offers similar exposure and holdings at a lower cost. We cover over 7000 mutual funds and over 400 ETFs. Investors have plenty of alternatives to these overpriced funds.
Figure 6 shows the worst fund in each sector according to our total annual costs rating. No ETFs ranks as the most expensive for any sector category.
Figure 6: Sector Funds With Highest Costs
 Source: New Constructs, LLC and company filings
Kyle Guske II contributed to this report.
Disclosure: David Trainer owns ALL. David Trainer and Kyle Guske II receive no compensation to write about any specific stock, sector or theme.