The All Cap Blend style ranks third out of the twelve fund styles as detailed in my Style Rankings for ETFs and Mutual Funds report. It gets my Neutral rating, which is based on aggregation of ratings of 37 ETFs and 763 mutual funds in the All Cap Blend style as of April 10, 2014. Prior reports on the best & worst ETFs and mutual funds in every sector and style are here.
Figures 1 and 2 show the five best and worst-rated ETFs and mutual funds in the style. Not all All Cap Blend style ETFs and mutual funds are created the same. The number of holdings varies widely (from 12 to 3611), which creates drastically different investment implications and ratings. The best ETFs and mutual funds allocate more value to Attractive-or-better-rated stocks than the worst, which allocate too much value to Neutral-or-worse-rated stocks.
To identify the best and avoid the worst ETFs and mutual funds within the All Cap Blend style, investors need a predictive rating based on (1) stocks ratings of the holdings and (2) the all-in expenses of each ETF and mutual fund. Investors need not rely on backward-looking ratings. My fund rating methodology is detailed here.
Investors seeking exposure to the All Cap Blend style should buy one of the Attractive-or-better rated ETFs or mutual funds from Figures 1 and 2.
Get my ratings on all ETFs and mutual funds in this style by searching for All Cap Blend on my mutual fund and ETF screener. For more products, click here.
Figure 1: ETFs with the Best & Worst Ratings – Top 5
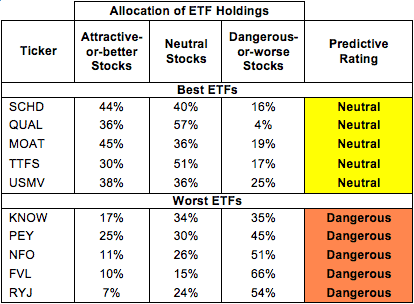 * Best ETFs exclude ETFs with TNAs less than $100 million for inadequate liquidity.
Sources: New Constructs, LLC and company filings
Figure 2: Mutual Funds with the Best & Worst Ratings – Top 5
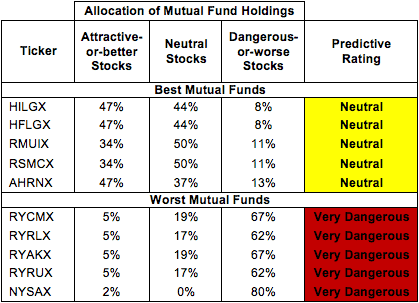 * Best mutual funds exclude funds with TNAs less than $100 million for inadequate liquidity.
Sources: New Constructs, LLC and company filings
Trust for Professional Managers: Jensen Quality Value Fund (JNVIX), Trust for Professional Managers: Jensen Quality Value Fund (JNVSX), and Boston Trust & Walden Funds: Walden Asset Management Fund (WSBFX) are excluded from Figure 2 because their total net assets (TNA) are below $100 million and do not meet our liquidity standards.
Schwab US Dividend Equity ETF (SCHD) is my top-rated All Cap Blend ETF and Hennessy Funds Trust: Hennessy Cornerstone Large Growth Fund (HILGX) is my top-rated All Cap Blend mutual fund. Both earn my Neutral rating.
Guggenheim Raymond James SB-1 Equity ETF (RYJ) is my worst-rated All Cap Blend ETF and Nysa Series Trust: Nysa Fund (NYSAX) is my worst-rated All Cap Blend mutual fund. RYJ earns my Dangerous rating and NYSAX earns my Very Dangerous rating.
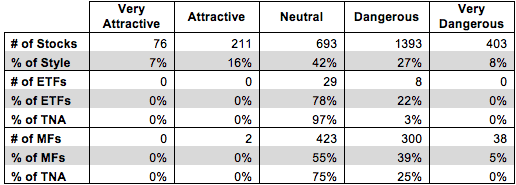
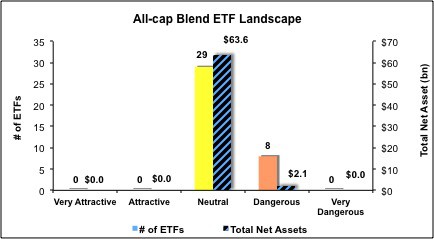
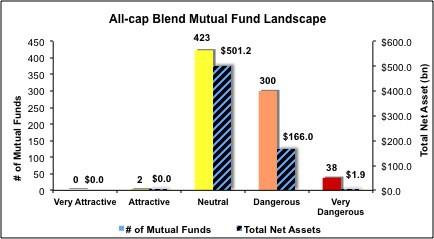
Figure 3 shows that 287 out of the 2776 stocks (over 23% of the market value) in All Cap Blend ETFs and mutual funds get an Attractive-or-better rating. However, 0 out of 37 All Cap Blend ETFs and 2 out of 763 All Cap Blend mutual funds (less than 1% of total net assets) get an Attractive-or-better rating.
The takeaways are: mutual fund managers allocate too much capital to low-quality stocks and All Cap Blend ETFs hold poor quality stocks.
Figure 3: All Cap Blend Style Landscape For ETFs, Mutual Funds & Stocks
 Sources: New Constructs, LLC and company filings
As detailed in “Low-Cost Funds Dupe Investors”, the fund industry offers many cheap funds but very few funds with high-quality stocks, or with what I call good portfolio management.
Investors need to tread carefully when considering All Cap Blend ETFs and mutual funds, as no ETFs and only two mutual funds in the All Cap Blend style allocate enough value to Attractive-or-better-rated stocks to earn an Attractive rating.
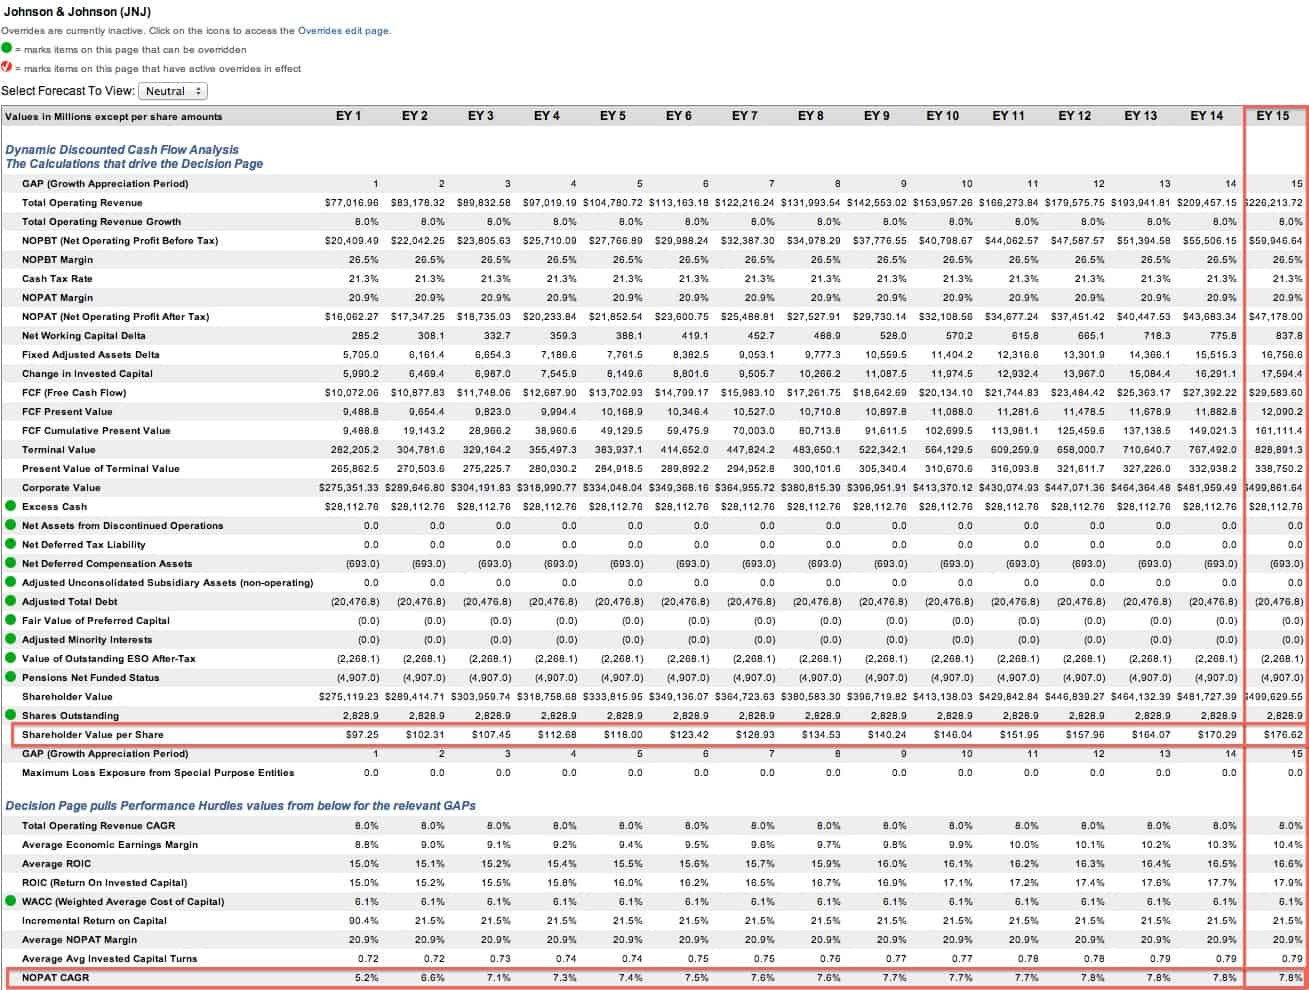
Johnson & Johnson (JNJ) is one of my favorite stocks held by SCHD and earns my Very Attractive rating. For the past 15 years, JNJ has grown after-tax profits (NOPAT) by 15% compounded annually. I recently wrote about how the company’s great product diversification gives it a consistency and resistance to cyclical downturns. JNJ also earns a top quintile return on invested capital (ROIC) of 15% and has generated positive economic earnings for the past 15 years. The best part about JNJ, however, is that it remains so undervalued. At it’s current valuation of ~$97/share, JNJ has a market implied growth appreciation period (GAP) of only 2 years. This is quite low considering the industry average of the companies I cover is over 65 years. If we give JNJ credit for 15 years of NOPAT growth at a modest rate of 8%, the stock is worth over $176/share today. JNJ offers a safe, long-term investment with great upside.
Amkor Technology, Inc. (AMKR) is one of my least favorite stocks held by FVL and earns my Dangerous rating. Since 2006, AMKR’s NOPAT has declined by 9% compounded annually while the company’s ROIC has fallen from 13% to 6%. The company has generated negative economic earnings in four of the past five years as well. To justify its current valuation of ~$7/share, AMKR would need to grow NOPAT by 6% compounded annually for the next 20 years. Lack of growth, declining profitability, and extremely high expectations make AMRK a stock investors should avoid.
Figures 4 and 5 show the rating landscape of all All Cap Blend ETFs and mutual funds.
My Style Rankings for ETFs and Mutual Funds report ranks all styles and highlights those that offer the best investments.
Figure 4: Separating the Best ETFs From the Worst Funds
 Sources: New Constructs, LLC and company filings
Figure 5: Separating the Best Mutual Funds From the Worst Funds
 Sources: New Constructs, LLC and company filings
Review my full list of ratings and rankings along with reports on all 37 ETFs and 763 mutual funds in the All Cap Blend style.
Kyle Guske II contributed to this report.
Disclosure: David Trainer and Kyle Guske II receive no compensation to write about any specific stock, sector, style or theme.