
Note to non-subscribers: We are no longer offering all of our reports for free. You may have noticed that many of the top experts in the financial sector value our reports quite highly. Barron’s has featured our best-in-market research seven times this year already as have USA Today, CNBC, MarketWatch.com, The Motley Fool, The Wall Street Journal, Abnormal Returns, Fox Business and the list goes on.
We are offering this report for free for the 3Q14 Best and Worst ETFs and Mutual Funds series. However, most of our reports, which include detailed analysis of all 10 sectors and 12 fund styles, will be available to subscribers only. We will be updating all the sector reports and all the style reports from last quarter. For a limited time, you can get access to all our reports for just $9.99/month.
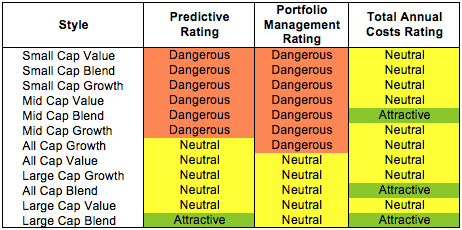
At the beginning of the third quarter of 2014, only the Large Cap Blend style earns an Attractive rating. My style ratings are based on the aggregation of my fund ratings for every ETF and mutual fund in each style.
Investors looking for style funds that hold quality stocks should look no further than the Large Cap Blend, Large Cap Growth, and Large Cap Value styles. These styles house Attractive-or-better rated funds. Figures 6 and 7 provide details. The primary driver behind an Attractive fund rating is good portfolio management, or good stock picking, with low total annual costs.
Note that the Attractive-or-better Predictive ratings do not always correlate with Attractive-or-better total annual costs. This fact underscores that (1) cheap funds can dupe investors and (2) investors should invest only in funds with good stocks and low fees.
See Figures 4 through 13 for a detailed breakdown of ratings distributions by investment style. See my free ETF & mutual fund screener for rankings, ratings and free reports on 6800+ mutual funds and 400+ ETFs.
My fund rating methodology is detailed here.
All of my reports on the best & worst ETFs and mutual funds in every sector and investment style are available here.
Figure 1: Ratings For All Investment Styles
 Source: New Constructs, LLC and company filings
To earn an Attractive-or-better Predictive Rating, an ETF or mutual fund must have high-quality holdings and low costs. Only 2,133 style ETFs and mutual funds meet these requirements, which is only 32% of all style ETFs and mutual funds.
Schwab U.S. Dividend Equity ETF (SCHD) is my top Large Cap Blend mutual fund. It gets my Very Attractive rating by allocating over 32% of its value to Attractive-or-better-rated stocks.
Verizon Communications, Inc. (VZ) is one of my favorite stocks held by SCHD and gets my Attractive rating. Over the past five years, VZ has grown after-tax profit (NOPAT) by 10% compounded annually. Over the same timeframe, VZ has increased return on invested capital (ROIC) from 6% to 9%. The valuation does not seem to have caught up with the fundamentals, which creates a good opportunity to buy a quality company at a great price. At its current price of ~$50/share, VZ has a price to economic book value (PEBV) ratio of 1.2. This ratio implies that the market expects VZ to grow NOPAT by only 20% for the remaining life of the company. The expectation is rather low given that VZ has grown NOPAT by 10% a year for half a decade. Investors should take a look at VZ.
ProFunds: Small-Cap ProFund (SLPSX) is my worst Small Cap Blend mutual fund. It gets my Very Dangerous rating by allocating less than 2% of its value to Attractive-or-better rated stocks and holding 64% in cash. SLPSX has total annual costs of 5.61%, so investors are paying over 5% a year for SPLSX to hold most of their assets in cash.
SunEdison Inc. (SUNE) is one of my least favorite stocks held by SLPSX and earns my Dangerous rating. SUNE’s NOPAT has steadily declined in recent years, from -$50 million in 2009 to -$220 million last year. The company currently earns an ROIC of -5%, ranking it in the bottom quintile of all companies I cover. SUNE’s valuation looks irrationally high given its consistent and increasing losses. To justify its current price of ~$23/share, SUNE must achieve 20% pre-tax margins while growing revenue by 12% compounded annually for 13 years. Such high margins for a company that has not been able to operate profitably in recent years seems unlikely. Declining NOPAT and elevated expectations make SUNE a stock investors should avoid.
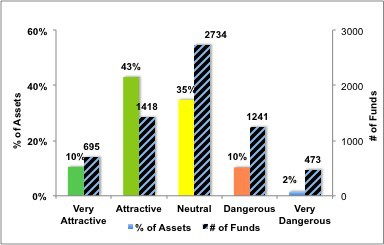
Figure 2 shows the distribution of our Predictive Ratings for all investment style ETFs and mutual funds.
Figure 2: Distribution of ETFs & Mutual Funds (Assets and Count) by Predictive Rating
 Source: New Constructs, LLC and company filings
Figure 3 offers additional details on the quality of the investment style funds. Note that the average Total Annual Cost of Very Dangerous funds is over 4 times that of Very Attractive funds.
Figure 3: Predictive Rating Distribution Stats
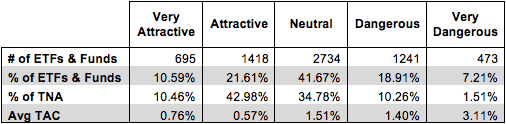 * Avg TAC = Weighted Average Total Annual Costs
Source: New Constructs, LLC and company filings
This table shows that only the best of the best funds get our Very Attractive Rating: they must hold good stocks AND have low costs. Investors deserve to have the best of both and we are here to give it to them.
Ratings by Investment Style
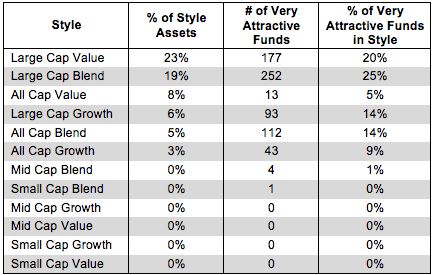
Figure 4 presents a mapping of Very Attractive funds by investment style. The chart shows the number of Very Attractive funds in each investment style and the percentage of assets in each style allocated to funds that are rated Very Attractive.
Only 695 investment style funds earn our Very Attractive rating.
Figure 4: Very Attractive ETFs & Mutual Funds by Investment Style
 Source: New Constructs, LLC and company filings
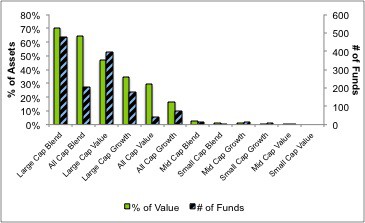
Figure 5 presents the data charted in Figure 4
Figure 5: Very Attractive ETFs & Mutual Funds by Investment Style
 Source: New Constructs, LLC and company filings
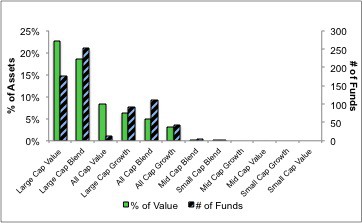
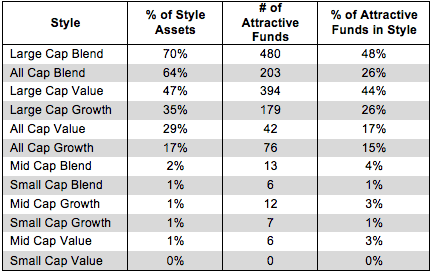
Figure 6 presents a mapping of Attractive funds by investment style. The chart shows the number of Attractive funds in each style and the percentage of assets allocated toAttractive-rated funds in each style.
Note that the Large Cap Value, Large Cap Blend, and Large Cap Growth styles hold majority of the Attractive-rated funds.
Figure 6: Attractive ETFs & Mutual Funds by Investment Style
 Source: New Constructs, LLC and company filings
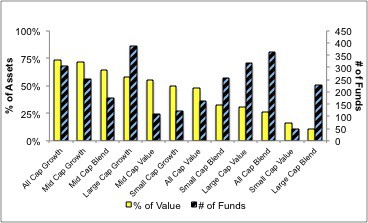
Figure 7 presents the data charted in Figure 6.
Figure 7: Attractive ETFs & Mutual Funds by Investment Style
 Source: New Constructs, LLC and company filings
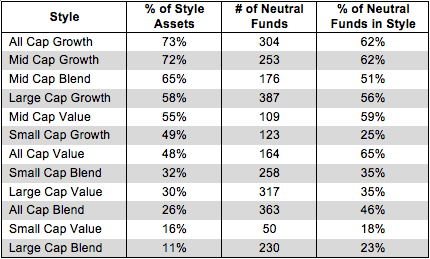
Figure 8 presents a mapping of Neutral funds by investment style. The chart shows the number of Neutral funds in each investment style and the percentage of assets allocated to Neutral-rated funds in each style.
Figure 8: Neutral ETFs & Mutual Funds by Investment Style
 Source: New Constructs, LLC and company filings
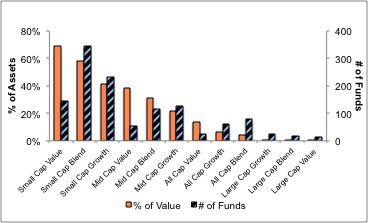
Figure 9 presents the data charted in Figure 8.
Figure 9: Neutral ETFs & Mutual Funds by Investment Style
 Source: New Constructs, LLC and company filings
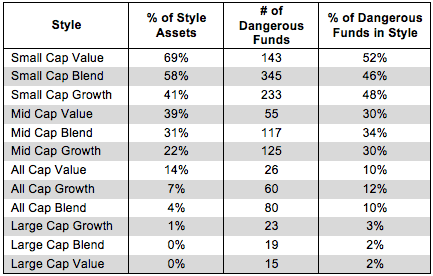
Figure 10 presents a mapping of Dangerous funds by fund style. The chart shows the number of Dangerous funds in each investment style and the percentage of assets allocated to Dangerous-rated funds in each style.
Figure 10: Dangerous ETFs & Mutual Funds by Investment Style
 Source: New Constructs, LLC and company filings
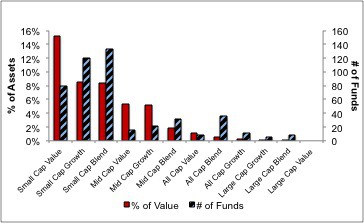
Figure 11 presents the data charted in Figure 10.
Figure 11: Dangerous ETFs & Mutual Funds by Investment Style
 Source: New Constructs, LLC and company filings
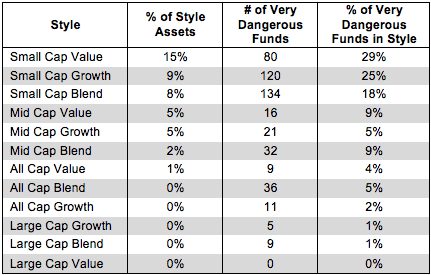
Figure 12 presents a mapping of Very Dangerous funds by fund style. The chart shows the number of Very Dangerous funds in each investment style and the percentage of assets in each style allocated to funds that are rated Very Dangerous.
Figure 12: Very Dangerous ETFs & Mutual Funds by Investment Style
 Source: New Constructs, LLC and company filings
Figure 13 presents the data charted in Figure 12.
Figure 13: Very Dangerous ETFs & Mutual Funds by Investment Style
 Source: New Constructs, LLC and company filings
Kyle Guske II contributed to this report.
Disclosure: David Trainer and Kyle Guske II receive no compensation to write about any specific stock, sector or theme.