Finding the best ETFs is an increasingly difficult task in a world with so many to choose from.
You Cannot Trust ETF Labels
There are at least 27 different Information Technology ETFs and at least 186 ETFs across all sectors. Do investors need that many choices? How different can the ETFs be?
Those 27 Information Technology ETFs are very different. With anywhere from 24 to 415 holdings, many of these Information Technology ETFs have drastically different portfolios, creating drastically different investment implications.
The same is true for the ETFs in any other sector as each offers a very different mix of good and bad stocks. Some sectors have lots of good stocks and offer quality funds. The opposite is true for some sectors, while others lie in between these extremes with a fair mix of good and bad stocks. For example, the Health Care sector, per my 3Q Sector Rankings Report ranks sixth out of 10 sectors when it comes to providing investors with quality ETFs. Consumer Staples ranks first. Utilities ranks last. Details on the Best & Worst ETFs in each sector are here
The bottom line is: ETF labels do not tell you the kind of stocks you are getting in any given ETF.
Paralysis By Analysis
I firmly believe ETFs for a given sector should not all be that different. I think the large number of Information Technology (or any other) sector of ETFs hurts investors more than it helps because too many options can be paralyzing. It is simply not possible for the majority of investors to properly assess the quality of so many ETFs. Analyzing ETFs, done with the proper diligence, is far more difficult than analyzing stocks because it means analyzing all the stocks within each ETF. As stated above, that can be as many as 415 stocks, and sometimes even more, for one ETF.
Any investor worth his salt recognizes that analyzing the holdings of an ETF is critical to finding the best ETF.
Figure 1: Best Sector ETFs
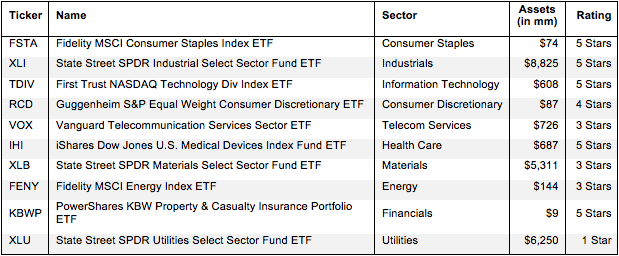 Sources: New Constructs, LLC and company filings
The Danger Within
Why do investors need to know the holdings of ETFs before they buy? They need to know to be sure they do not buy a fund that might blow up. Buying a fund without analyzing its holdings is like buying a stock without analyzing its business and finances. As Barron’s says, investors should know the Danger Within. No matter how cheap, if it holds bad stocks, the ETF’s performance will be bad.
PERFORMANCE OF FUND’S HOLDINGS = PERFORMANCE OF FUND
Finding the Sector ETFs with the Best Holdings
Figure 1 shows my top rated ETF for each sector. Importantly, my ratings on ETFs are based primarily on my stock ratings of their holdings. My firm covers over 3000 stocks and is known for the due diligence we do for each stock we cover. Accordingly, our coverage of ETFs leverages the diligence we do on each stock by rating ETFs based on the aggregated ratings of the stocks each ETF holds.
PowerShares KBW Property & Casualty Insurance Portfolio ETF (KBWP) is the top-rated Financials ETF and the overall highest rated fund of the 186 sector ETFs that I cover.
Sometimes, You Get What You Pay For
It is troubling to see one of the best sector ETFs, Guggenheim S&P Equal Weight Consumer Discretionary ETF (RCD) have just $87 million in assets despite its Attractive or 4-star rating. On the other hand, Neutral rated Vanguard Consumer Discretionary Sector ETF (VCR) has $1.2 billion in assets. VCR has lower total annual coststhan KBWP (0.15% and 0.55% respectively), but low costs cannot drive positive performance. Quality holdings are the ultimate driver of performance.
I cannot help but wonder if investors would leave VCR if they knew that it has such a poor portfolio of stocks. It is cheaper than RCD, but, as previously stated, low fees cannot growth wealth; only good stocks can.
Sometimes, You DON’T Get What You Pay For
Fidelity MSCI Energy Index ETF (FENY) is one of the smallest ETFs in Figure 1 with just $147 million in assets. Sadly, other Energy ETFs with more assets and inferior portfolios charge more than FSTA In other words, Consumer Staples ETF investors are paying extra fees for no reason.
First Trust Energy AlphaDEX Fund ETF (FXN) is one of the worst ETFs in the Energy sector. It gets my Dangerous rating based off the fact that less than 12% of its assets are allocated to Attractive-or-better rated stocks, while 72% is allocated to Dangerous-or-worse stocks. FXN also has total annual costs of 0.78%, higher than FENY’s 0.13%. One would think that FXN would have fewer assets than FENY, but instead it has over $800 million. Investors are paying extra fees for poor holdings.
The worst ETF in Figure 1 is State Street SPDR Utilities Select Sector Fund ETF (XLU), which gets a Very Dangerous (1 star) rating. One would think ETF providers could do better for this sector.
I recommend investors only buy ETFs with more than $100 million in assets. You can find more liquid alternatives for the other funds on my ETF screener.
Covering All The Bases, Including Costs
My ETF ratings also takes into account the total annual costs, which represents the all-in cost of being in the ETF. This analysis is complex for mutual funds, but straightforward for ETFs, where all costs are factored into the expense ratio. While costs play a smaller role than holdings, my ratings penalize those ETFs with abnormally high costs.
Top Stocks Make Up Top ETFs
Medtronic Inc. (MDT) is one of my favorite holdings in iShares Dow Jones U.S. Medical Devices Index Fund ETF (IHI) and earns my Attractive rating. Over the past decade, MDT has grown after-tax profit (NOPAT) by 9% compounded annually, and it currently earns a return on invested capital (ROIC) of 13%. Despite its consistent profit growth, MDT remains cheaply valued. At its current price of ~$62/share, MDT has a price to economic book value (PEBV) ratio of 1.1. This ratio implies that the market expects MDT to grow NOPAT by only 10% for the remaining life of the company. MDT should have no trouble surpassing such low expectations. Allocation to high quality stocks such as MDT makes IHI the top rated ETF in the Health Care sector.
Kyle Guske II contributed to this post.
Disclosure: David Trainer and Kyle Guske II receive no compensation to write about any specific stock, sector, or theme.