Picking from the multitude of style mutual funds is a daunting task. In any given style there may be as many as 914 different mutual funds, and there are at least 6222 mutual funds across all styles.
Why are there so many mutual funds? The answer is: because mutual fund providers are making lots of money selling them. The number of mutual funds has little to do with serving investors’ best interests. Below are three red flags investors can use to avoid the worst mutual funds:
- Inadequate liquidity
- High fees
- Poor quality holdings
I address these red flags in order of difficulty. Advice on How to Find the Best Style Mutual Funds is here. Details on the Best & Worst mutual funds in each style are here.
How To Avoid Mutual Funds with Inadequate Liquidity
This is the easiest issue to avoid, and my advice is simple. Avoid all mutual funds with less than $100 million in assets. Low levels of liquidity can lead to a discrepancy between the price of the mutual fund and the underlying value of the securities it holds. In addition, low asset levels tend to mean lower volume in the mutual fund and large bid-ask spreads.
How To Avoid High Fees
Mutual funds should be cheap, but not all of them are. The first step is to know what is cheap and expensive.
To ensure you are paying at or below average fees, invest only in mutual funds with total annual costs below 1.97%, which is the average total annual costs of the 6222 U.S. equity mutual funds I cover. Weighting the total annual costs by assets under management, the average total annual costs are lower at 1.31%. A lower weighted average is a good sign that investors are putting money in the cheaper mutual funds.
Figure 1 shows the most and least expensive style mutual funds in the U.S. equity universe based on total annual costs. No one provider provides multiples of the most expensive mutual funds while Fidelity mutual funds are among the cheapest.
Figure 1: 5 Least and Most Expensive Style Mutual Funds
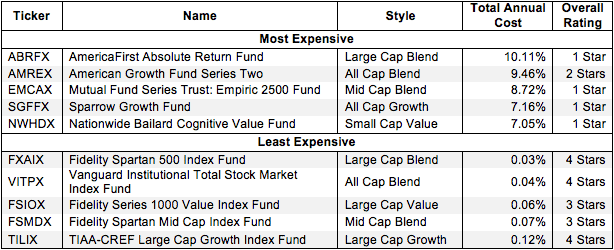 Sources: New Constructs, LLC and company filings
AmericaFirst Absolute Return Fund (ABRFX) and American Growth Fund Series Two (AMREX) are two of the most expensive U.S. equity mutual funds I cover, Fidelity Spartan 500 Index Fund (FXAIX) and Fidelity Mid Cap Index Fund (FSMDX) are the least expensive.
However, investors need not pay high fees for good holdings. Fidelity Spartan 500 Index Fund (FXAIX) is one of my highest-rated style mutual funds and earns my Attractive rating. It also has low total annual costs of only 0.03%.
On the other hand, FSIOX and FSMDX hold poor stocks. No matter how cheap a mutual fund, if it holds bad stocks, its performance will be bad.
This result highlights why investors should not choose mutual funds based only on price. The quality of holdings matters more than price.
How To Avoid Mutual Funds with the Worst Holdings
This step is by far the hardest, but it is also the most important because a mutual fund’s performance is determined more by its holdings than its costs. Figure 2 shows the mutual funds within each style with the worst holdings or portfolio management ratings. The styles are listed in descending order by overall rating as detailed in my 3Q Style Ratings report.
Figure 2: Style Mutual Funds with the Worst Holdings
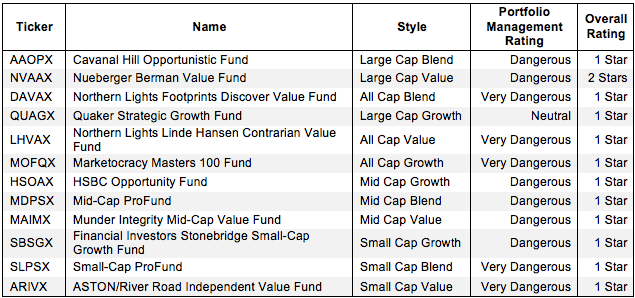 Sources: New Constructs, LLC and company filings
My overall ratings on mutual funds are based primarily on my stock ratings of their holdings. My firm covers over 3000 stocks and is known for the due diligence done on each stock we cover.
Northern Lights Trust appears more often than any other provider in Figure 2, which means that they offer the most mutual funds with the worst holdings. LHVAX has the worst holdings of all All Cap Value mutual funds. HSOAX, MDPSX, and NVAAX all have the worst holdings in their respective styles.
Note that no ETFs with a dangerous portfolio management rating earn an overall rating better than two stars. These scores are consistent with my belief that the quality of an ETF is more about its holdings than its costs. If the ETF’s holdings are dangerous, then the overall rating cannot be better than dangerous because one cannot expect the performance of the ETF to be any better than the performance of its holdings.
Find the mutual funds with the worst overall ratings on my mutual fund screener. More analysis of the Best Style mutual funds is here.
The Danger Within
Buying a mutual fund without analyzing its holdings is like buying a stock without analyzing its business and finances. As Barron’s says, investors should know the Danger Within. Put another way, research on mutual fund holdings is necessary due diligence because a mutual fund’s performance is only as good as its holdings’ performance.
PERFORMANCE OF MUTUAL FUND’s HOLDINGs = PERFORMANCE OF MUTUAL FUND
Best & Worst Stocks In These Mutual Funds
Benchmark Electronics, Inc. (BHE) is one of my least favorite stocks held by NWHDX and earns my Very Dangerous rating. Over the past nine years, BHE’s after tax profit (NOPAT) has grown by only 1% compounded annually. The company’s return on invested capital (ROIC) has also declined from 11% in 2004 to 6% in 2013. BHE has generated positive economic earnings in only one of the last 10 years. Despite its stagnant profit growth, BHE is overvalued. To justify its current price of ~$24/share, BHE must grow NOPAT by 12% compounded annually for the next 26 years. Not only is the expectation of a double-digit profit growth rate overly optimistic for this company, it is even harder to believe that BHE could maintain this level of growth for nearly three decades. Investors should avoid BHE.
CIGNA Corporation (CI) is one of my favorite holdings in TILIX and earns my Attractive rating. Over the past decade, CI has grown NOPAT by 13% compounded annually. CI currently earns an ROIC of 12% and has generated positive economic earnings in nine of the past 10 years. Even with the stock up around 5% this year, CI remains undervalued. At its current price of ~$91/share, CI has a price to economic book value (PEBV) ratio of 1.2. This ratio implies the market expects CI’s NOPAT to grow by only 20% from its current level for the remaining life of the corporation. This low expectation is awfully pessimistic for a company that has grown profits by double digits annually for the past 10 years. Investors should give CI serious consideration.
Kyle Guske II contributed to this article
Disclosure: David Trainer and Kyle Guske II receive no compensation to write about any specific stock, style, or theme.