
The Materials sector ranks seventh out of the ten sectors as detailed in my Sector Rankings for ETFs and Mutual Funds report. It gets my Dangerous rating, which is based on aggregation of ratings of 11 ETFs and 15 mutual funds in the Materials sector as of July 16, 2014. Prior reports on the best & worst ETFs and mutual funds in every sector are here.
Figure 1 ranks from best to worst the eight Materials ETFs that meet our liquidity standards and Figure 2 shows the five best and worst-rated Materials mutual funds. Not all Materials sector ETFs and mutual funds are created the same. The number of holdings varies widely (from 30 to 148). This variation creates drastically different investment implications and, therefore, ratings. The best ETFs and mutual funds allocate more value to Attractive-or-better-rated stocks than the worst ETFs and mutual funds, which allocate too much value to Neutral-or-worse-rated stocks.
To identify the best and avoid the worst ETFs and mutual funds within the Materials sector, investors need a predictive rating based on (1) the stocks ratings of the holdings, (2) the all-in expenses of each ETF and mutual fund, and (3) the fund’s rank compared to all other ETFs and mutual funds. As a result, only the cheapest funds with the best holdings receive Attractive or better ratings. Investors need not rely on backward-looking ratings. My fund rating methodology is detailed here.
Investors should not buy any Materials ETFs or mutual funds because none get an Attractive-or-better rating. If you must have exposure to this sector, you should buy a basket of Attractive-or-better rated stocks and avoid paying undeserved fund fees. Active management has a long historyof not paying off. Here’s the list of our top-rated Materials stocks.
Get my ratings on all ETFs and mutual funds in this sector on my mutual fund and ETF screener.
Figure 1: ETFs with the Best & Worst Ratings
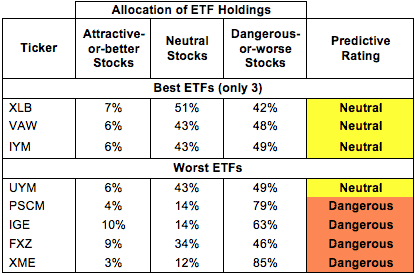
* Best ETFs exclude ETFs with TNAs less than $100 million for inadequate liquidity.
Sources: New Constructs, LLC and company filings
Guggenheim S&P Equal Weight Materials ETF(RTM) and Fidelity MSCI Materials Index ETF (FMAT) are excluded from Figure 1 because their total net assets (TNA) are below $100 million and do not meet our liquidity minimums.
Figure 2: Mutual Funds with the Best & Worst Ratings – Top 5
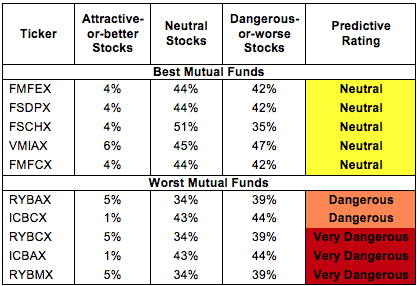
* Best mutual funds exclude funds with TNAs less than $100 million for inadequate liquidity.
Sources: New Constructs, LLC and company filings
State Street SPDR Materials Select Sector Fund ETF (XLB) is my top-rated Materials ETF and Fidelity Select Portfolios: Fidelity Advisor Materials Fund (FMFEX) is my top-rated Materials mutual fund. Both earn my Neutral rating.
State Street SPDR S&P Metals and Mining ETF (XME) is my worst-rated Materials ETF and Rydex Series Funds: Basic Materials Fund (RYBMX) is my worst-rated Materials mutual fund. XME earns my Dangerous rating and RYBMX earns my Very Dangerous rating.
Figure 3 shows that 12 out of the 233 stocks (over 7% of the market value) in Materials ETFs and mutual funds get an Attractive-or-better rating. Also, 0 out of 11 Materials ETFs and 0 out of 15 Materials mutual funds get an Attractive-or-better rating.
The takeaways are: mutual fund managers allocate too much capital to low-quality stocks and Materials ETFs hold poor quality stocks.
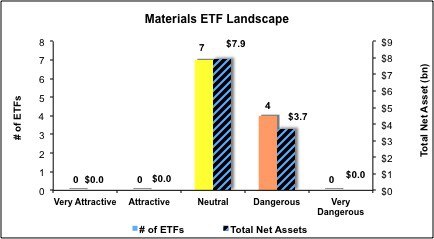
Figure 3: Materials Sector Landscape For ETFs, Mutual Funds & Stocks
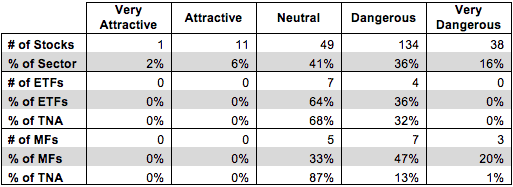
Sources: New Constructs, LLC and company filings
As detailed in “Low-Cost Funds Dupe Investors”, the fund industry offers many cheap funds but very few funds with high-quality stocks, or with what I call good portfolio management.
Investors need to tread carefully when considering Materials ETFs and mutual funds, as there are not many quality ones to choose from. No ETFs and mutual funds in the Materials sector allocate enough value to Attractive-or-better-rated stocks to earn an Attractive rating. Investors looking at this sector would be better suited buying individual stocks.
CF Industries Holdings, Inc. (CF) is one of my favorite stocks held by Materials ETFs and mutual funds and earns my Very Attractive rating. For the past five years, CF has grown after-tax profit (NOPAT) by 14% compounded annually. CF currently earns a 21% return on invested capital (ROIC), placing it in the top quintile of all companies I cover. CF has also generated positive economic earnings every year since 2007. The best news of all is that the market hasn’t realized the true value of CF yet, leaving it largely undervalued. At its current price of ~$254/share, CF has a price to economic book value (PEBV) ratio of 0.8. This ratio implies that the market expects CF’s NOPAT to permanently decline by 20% from its current levels. CF’s track record of profit growth suggests that the market’s fears are overstated.
Sealed Air Corp (SEE) is one of my least favorite stocks held by Materials ETFs and mutual funds and earns my Very Dangerous rating. Over the past six years, SEE has grown NOPAT by only 2% compounded annually. This performance compares badly to the 12% average growth rate for the 13 Container and Packaging companies I cover. Over the same time frame, SEE’s ROIC has fallen from 11% down to 6%. Making matters worse, the stock is priced for significant profit growth. In order to justify its current price of ~$37/share, SEE would need to grow NOPAT by 10% compounded annually for the next 33 years. Not only is double-digit growth unlikely given the company’s track record, but also maintaining that level of growth for 33 years of growth is an overly optimistic expectation.
152 stocks of the 3000+ I cover are classified as Materials stocks.
Figures 4 and 5 show the rating landscape of all Materials ETFs and mutual funds.
My Sector Rankings for ETFs and Mutual Funds report ranks all sectors and highlights those that offer the best investments.
Figure 4: Separating the Best ETFs From the Worst ETFs
Sources: New Constructs, LLC and company filings
Figure 5: Separating the Best Mutual Funds From the Worst Mutual Funds
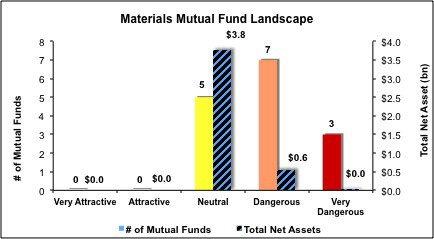
Sources: New Constructs, LLC and company filings
Review my full list of ratings and rankings along with reports on all 11 ETFs and 15 mutual funds in the Materials sector.
Kyle Guske II contributed to this report.
Disclosure: David Trainer owns CF. David Trainer and Kyle Guske II receive no compensation to write about any specific stock, sector or theme.