The Small Cap Growth style ranks tenth out of the twelve fund styles as detailed in my Style Rankings for ETFs and Mutual Funds report. It gets my Dangerous rating, which is based on aggregation of ratings of 11 ETFs and 464 mutual funds in the Small Cap Growth style as of July 31, 2014. Prior reports on the best & worst ETFs and mutual funds in every sector and style are here.
Figures 1 and 2 show the five best and worst-rated ETFs and mutual funds in the style. Not all Small Cap Growth style ETFs and mutual funds are created the same. The number of holdings varies widely (from 27 to 1702). This variation creates drastically different investment implications and, therefore, ratings. The best ETFs and mutual funds allocate more value to Attractive-or-better-rated stocks than the worst, which allocate too much value to Neutral-or-worse-rated stocks.
To identify the best and avoid the worst ETFs and mutual funds within the Small Cap Growth sector, investors need a predictive rating based on (1) the stocks ratings of the holdings, (2) the all-in expenses of each ETF and mutual fund, and (3) the fund’s rank compared to all other ETFs and mutual funds. As a result, only the cheapest funds with the best holdings receive Attractive or better ratings. Investors need not rely on backward-looking ratings. My fund rating methodology is detailed here.
Investors seeking exposure to the Small Cap Growth style should buy one of the Attractive-or-better rated ETFs or mutual funds from Figures 1 and 2.
Get my ratings on all ETFs and mutual funds in this style by searching for Small Cap Growth on my mutual fund and ETF screener.
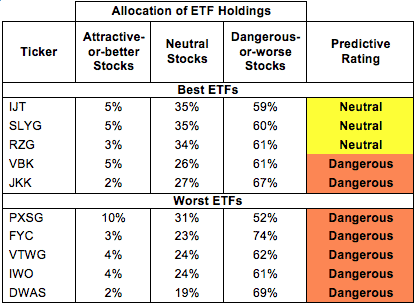
Figure 1: ETFs with the Best & Worst Ratings – Top 5
Sources: New Constructs, LLC and company filings
*Best ETFs exclude ETFs with TNAs less than $100 million for inadequate liquidity.
Vanguard S&P Small-Cap 600 Growth ETF (VIOG) is excluded from Figure 1 because its total net assets (TNA) are below $100 million and do not meet our liquidity minimums.
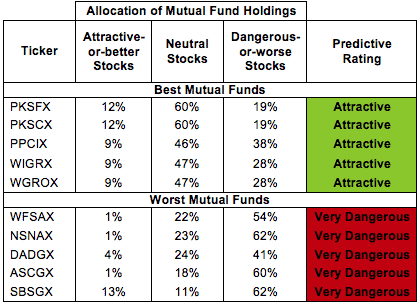
Figure 2: Mutual Funds with the Best & Worst Ratings – Top 5
Sources: New Constructs, LLC and company filings
* Best mutual funds exclude funds with TNAs less than $100 million for inadequate liquidity.
iShares S&P SmallCap 600 Growth Index Fund ETF (IJT) is my top-rated Small Cap Growth ETF and Virtus Small-Cap Core Fund (PKSFX) is my top-rated Small Cap Growth mutual fund. IJT earns my Neutral rating and PKSFX earns my Attractive rating.
PowerShares DWA Small Cap Technical Momentum (DWAS) is my worst-rated Small Cap Growth ETF and Financial Investors Trust: Stonebridge Small-Cap Growth Fund (SBSGX) is my worst-rated Small Cap Growth mutual fund. DWAS earns my Dangerous rating and SBSGX earns my Very Dangerous rating.
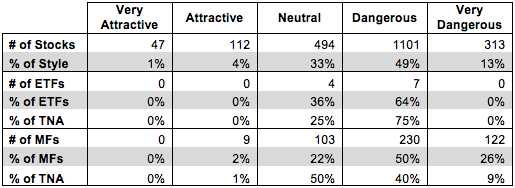
Figure 3 shows that 159 out of the 2067 stocks (over 5% of the market value) in Small Cap Growth ETFs and mutual funds get an Attractive-or-better rating. However, 0 out of 11 Small Cap Growth ETFs and 9 out of 464 Small Cap Growth mutual funds (less than 1% of total net assets) get an Attractive-or-better rating.
The takeaways are: mutual fund managers allocate too much capital to low-quality stocks and Small Cap Growth ETFs hold poor quality stocks.
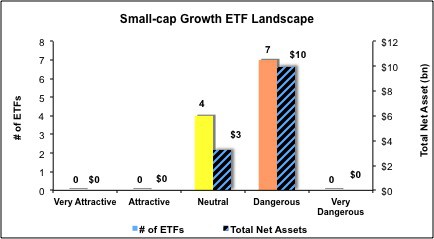
Figure 3: Small Cap Growth Style Landscape For ETFs, Mutual Funds & Stocks
Sources: New Constructs, LLC and company filings
As detailed in “Cheap Funds Dupe Investors”, the fund industry offers many cheap funds but very few funds with high-quality stocks, or with what I call good portfolio management.
Investors need to tread carefully when considering Small Cap Growth ETFs and mutual funds, as no ETFs and only 9 mutual funds in the Small Cap Growth style allocate enough value to Attractive-or-better-rated stocks to earn an Attractive rating.
Strattec Security (STRT) is one of my favorite stocks held by Small Cap Growth ETFs and mutual funds and earns my Attractive rating. Since 2010, STRT has grown after-tax profit (NOPAT) by 60% compounded annually. STRT also increased its return on invested capital (ROIC) from 3% in 2010 to 14% in 2014. Despite this rapid NOPAT growth and increasing profitability, STRT remains undervalued. At its current price of ~$84/share, STRT has a price to economic book value (PEBV) ratio of 0.9. This ratio implies that the market expects STRT’s NOPAT to permanently decline by 10% from current levels. Even if STRT is unable to sustain its outstanding profit growth of late, the expectation that the company’s NOPAT will permanently decline seems awfully pessimistic.
KapStone Paper and Packaging Corp (KS) is one of my least favorite stocks held by Small Cap Growth ETFs and mutual funds and earns my Dangerous rating. KS has a decent ROIC of 10%, but that is down from 13% in 2011 and 18% in 2007. Major acquisitions, including a $1 billion acquisition of Longview Fibre Paper and Packaging in 2013, have grown revenue and accounting earnings for KS but decreased economic earnings. KS has also built up significant liabilities in the form of $1.3 billion in debt and 450 million in deferred tax liabilities. These liabilities, combined with the tripling of KS stock over the past few years, set high expectations for the company. In order to justify its valuation of ~$30/share, KS must grow NOPAT by 15% compounded annually for 14 years. It’s hard to see how the company can manage such spectacular profit growth as its return on capital declines.
Figures 4 and 5 show the rating landscape of all Small Cap Growth ETFs and mutual funds.
My Style Rankings for ETFs and Mutual Funds report ranks all styles and highlights those that offer the best investments.
Figure 4: Separating the Best ETFs From the Worst Funds
Sources: New Constructs, LLC and company filings
Figure 5: Separating the Best Mutual Funds From the Worst Funds

Sources: New Constructs, LLC and company filings
Review my full list of ratings and rankings along with reports on all 11 ETFs and 464 mutual funds in the Small Cap Growth style.
Kyle Guske II contributed to this report.
Disclosure: David Trainer and Kyle Guske II receive no compensation to write about any specific stock, sector, style or theme.