
This report shows how well Energy sector ETFs and mutual fund managers pick stocks. We juxtapose our Portfolio Management rating on funds, which grades managers based on the quality of the stocks they choose, with the number of good stocks available in the sector. This analysis shows whether or not ETF providers and mutual fund managers deserve their fees.
For example, if a fund has a poor Portfolio Management rating in a sector where there are lots of good stocks, that fund does not deserve the fees it charges, and investors are much better off putting money in a passively-managed fund or investing directly in the sector’s good stocks. On the other hand, if a fund has a good Portfolio Management rating in a sector where there are lots of bad stocks, then investors should put money in that fund assuming the fund’s costs are competitive.
Figure 1 shows how many good stocks, according to our nationally-recognized ratings, are in the sector and their market cap. Next, it juxtaposes the Portfolio Management ratings of the ETFs and mutual funds in the sector. We think investors can gain an advantage with our forward-looking fund ratings since past performance is not a reliable predictor of future returns.
Figure 1 shows that 21 out of the 357 stocks (only 11% of the market value) in Energy ETFs and mutual funds get an Attractive-or-better rating.
The main takeaway from Figure 1 is that no ETFs allocate enough to quality stocks to earn an Attractive-or-better Portfolio Management rating. ETF providers in the Energy sector are not earning their fees. Mutual fund managers have not fared much better. No mutual funds allocate enough of their assets to quality stocks to earn an Attractive-or better Portfolio Management rating either.
With no quality ETFs it is not surprising where investors are placing their money. Investing in Energy ETFs forces money into poorly rated ETFs. The picture is no better for mutual fund investors as 96% of investor assets are allocated to Dangerous-or-worse rated mutual funds. With only 1 mutual fund earning even a Neutral Portfolio Management rating, investors would be better off sticking with individual stocks since they won’t be charged unnecessary fees.
It is unfortunate to see such a large percentage of total net assets allocated to Dangerous-or-worse rated funds.
Figure 1: Energy Sector: Comparing Quality of Stock Picking To Quality Of Stocks Available
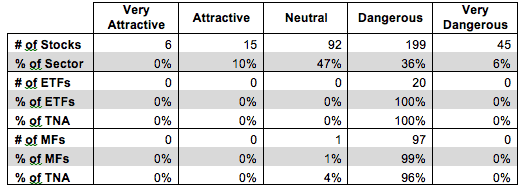
Sources: New Constructs, LLC and company filings
ProShares Ultra Oil & Gas ETF (DIG) has the highest portfolio management rating of all Energy ETFs and earns my Dangerous Portfolio Management rating. Fidelity Energy Service Portfolio (FSESX) has the highest portfolio management rating of all Energy mutual funds and earns my Neutral rating.
PowerShares S&P SmallCap Energy (PSCE) has the lowest portfolio management rating of all Energy ETFs and earns my Dangerous Portfolio Management rating. BlackRock Energy & Resources Portfolio (SGLSX) has the lowest portfolio management rating of all Energy mutual funds and earns my Dangerous rating.
CVR Energy, Inc. (CVI) is one of my favorite stocks held by Energy ETFs and mutual funds and earns my Very Attractive rating. Energy stocks have not fared well this year, with stock prices down nearly 2% this year and 12% in the past three months. CVI’s stock price has declined with the rest of the sector and is now undervalued. Since 2008, CVR has grown after tax profit (NOPAT) by 27% compounded annually. Over this time, the company has increased its return on invested capital (ROIC) from 10% to a top quintile 18% in 2013. At its current price of ~$42/share, CVR Energy has a price to economic book value (PEBV) ratio of just 1.1. This ratio implies that CVR will grow NOPAT by only 10% from current levels over the remaining life of the company. Such a low NOPAT growth expectation seems low given the company’s five years of double digit growth.
Peabody Energy Corp (BTU) is one of my least favorite stocks held by Energy ETFs and mutual funds and earns my Very Dangerous rating. Over the last four years, BTU’s NOPAT has declined by 42% compounded annually. Its ROIC fell to 1% in 2013, which places it in the bottom quintile of all companies I cover. Similarly, BTU has generated negative economic earnings in the last two years. So far in 2014, the company has not fared much better. BTU reported stagnant revenues year over year in their 2Q14 earnings release. Investors have taken notice, with BTU’s stock price down over 30% so far, but I believe it has further to fall. To justify its current price of ~$10/share, BTU must grow NOPAT by 10% compounded annually for the next 12 years. With coal exports in a decline since 2012 and BTU’s inability to grow NOPAT over the past four years, it seems unlikely that they would be able to suddenly right the course and meet these optimistic expectations. Investors should avoid BTU.
Many ETFs and mutual funds managers do a poor job identifying quality stocks. They allocate heavily to overvalued stocks like Peabody Energy and don’t hold high quality stocks such as CVR Energy. These funds are not worth owning at any cost.
The emphasis that traditional research places on low costs is a positive for investors, but low fees alone do not drive performance. Only good holdings can. Don’t fall prey to the index label myths. Even “passive” investors should be analyzing the holdings of their funds.
Our Best & Worst ETFs and Mutual Funds for the Energy Sector report reveals our predictive ratings on the best and worst funds in the sector.
Kyle Guske II contributed to this report.
Disclosure: David Trainer and Kyle Guske II receive no compensation to write about any specific stock, sector, or theme.