
This report shows how well Industrials ETFs and mutual fund managers pick stocks. We juxtapose our Portfolio Management Rating on funds, which grades managers based on the quality of the stocks they choose, with the number of good stocks available in the sector. This analysis shows whether or not ETF providers and mutual fund managers deserve their fees.
For example, if a fund has a poor Portfolio Management Rating in a sector where there are lots of good stocks, that fund does not deserve the fees it charges, and investors are much better off putting money in a passively-managed fund or investing directly in the sector’s good stocks. On the other hand, if a fund has a good Portfolio Management Rating in a sector where there are lots of bad stocks, then investors should put money in that fund, assuming the fund’s costs are competitive.
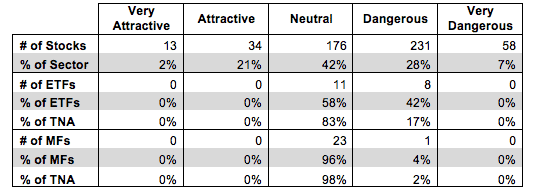
Figure 1 shows how many good stocks, according to our nationally-recognized ratings, are in the sector and their collective market cap. Next, it juxtaposes the Portfolio Management Ratings of the ETFs and mutual funds in the sector. We think investors can gain an advantage with our forward-looking fund ratings since past performance is not a reliable predictor of future returns.
Figure 1 shows that 47 out of the 512 stocks (over 23% of the market value) in Industrials ETFs and mutual funds get an Attractive-or-better Portfolio Management Rating.
The main takeaway from Figure 1 is that ETF providers and mutual fund managers are not allocating to quality stocks.
Zero out 19 of ETFs allocate enough to quality stocks to earn an Attractive-or-better Portfolio Management Rating. Mutual fund managers have not fared much better as zero out of 14 mutual funds allocate enough of their assets to quality stocks to earn an Attractive-or better Portfolio Management Rating. ETF providers and mutual fund managers need to do a better job to justify their fees.
On a positive note, investors have chosen as best they could for the sector, with over 83% of total net assets (TNA) in ETFs with Neutral Portfolio Management Ratings. Similarly, 96% of TNA in mutual funds is invested in funds that earn a Neutral Portfolio Management Rating.
It is encouraging to see such a large percentage of total net assets allocated to funds with Neutral Portfolio Management Ratings rather than Dangerous-or-worse ratings. Investors do a good job of recognizing the best possible funds in the Industrials sector.
Figure 1: Industrials Sector: Comparing Quality of Stock Picking to Quality of Stocks Available
Sources: New Constructs, LLC and company filings
ProShares Ultra Industrials ETF (UXI) has the highest Portfolio Management Rating of all Industrials ETFs and earns my Neutral Portfolio Management Rating. Putnam Global Industrials Fund (PGIAX) has the highest Portfolio Management Rating of all Industrials mutual funds and earns my Neutral Portfolio Management Rating. Despite the highest Portfolio Management Rating in the sector, PGIAX’s high Total Annual Costs earn it my Dangerous overall rating.
State Street SPDR S&P Transportation ETF (XTN) has the lowest Portfolio Management Rating of all Industrials ETFs and earns my Dangerous Portfolio Management Rating. Fidelity Select Environment and Alternative Energy Portfolio (FSLEX) has the lowest Portfolio Management Rating of all Industrials mutual funds and earns my Dangerous Portfolio Management Rating.
Lockheed Martin Corp (LMT) is one of my favorite stocks held by Industrials ETFs and mutual funds and earns my Attractive rating. Over the past decade, Lockheed Martin has grown after-tax profit (NOPAT) by 11% compounded annually. In 2013, the company earned a return on invested capital (ROIC) of 11%, up from 6% in 2003. Lockheed’s stock price has pulled back recently and is down nearly 5% in the past two weeks, which creates a great opportunity for investors. At its current price of ~$174/share, LMT has a price to economic book value (PEBV) ratio of 1.2. This ratio implies that the market expects LMT to grow NOPAT by only 20% for the remaining life of the corporation. This expectation is low for Lockheed, which has a track record of double-digit annual NOPAT growth over the past decade. Investors should consider LMT after its recent dip.
SkyWest Inc. (SKYW) is one of my least favorite stocks held by Industrials ETFs and mutual funds and earns my Very Dangerous rating. Over the past four years, SkyWest’s NOPAT has declined by 13% compounded annually. The company’s ROIC has also fallen from 8% in 2006 to 4% in 2013, which puts it in the bottom quintile of all companies I cover. The last time SkyWest generated positive economic earnings was in 2002. Despite its rapid decline in profitability, SKYW remains overvalued. To justify its current price of ~$7/share, SKYW must grow NOPAT by 8% compounded annually for the next 26 years. These high expectations would be difficult for any company to meet, especially a struggling airline company like SkyWest. The market’s overly optimistic expectations for SkyWest coupled with the company’s declining profits make this stock one to avoid.
Many ETF providers and mutual fund managers do a poor job identifying quality stocks. Their funds allocate heavily to overvalued stocks like SkyWest and don’t hold high quality stocks such as Lockheed Martin. These funds are not worth owning at any cost.
The emphasis that traditional research places on low costs is a positive for investors, but low fees alone do not drive performance. Only good holdings can. Don’t fall prey to the index label myths. Even “passive” investors should be analyzing the holdings of their funds.
Our Best & Worst ETFs and Mutual Funds for the Industrials Sector report reveals our predictive ratings on the best and worst funds in the sector.
Kyle Guske II contributed to this report.
Disclosure: David Trainer and Kyle Guske II receive no compensation to write about any specific stock, sector, or theme.