
This report shows how well Information Technology ETFs and mutual fund managers pick stocks. We juxtapose our Portfolio Management Rating on funds, which grades managers based on the quality of the stocks they choose, with the number of good stocks available in the sector. This analysis shows whether or not ETF providers and mutual fund managers deserve their fees.
For example, if a fund has a poor Portfolio Management Rating in a sector where there are lots of good stocks, that fund does not deserve the fees it charges, and investors are much better off putting money in a passively-managed fund or investing directly in the sector’s good stocks. On the other hand, if a fund has a good Portfolio Management Rating in a sector where there are lots of bad stocks, then investors should put money in that fund, assuming the fund’s costs are competitive.
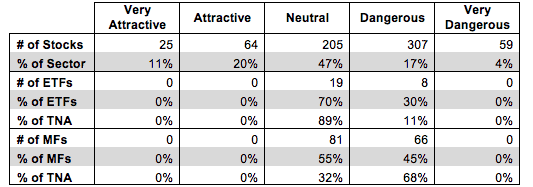
Figure 1 shows how many good stocks, according to our nationally-recognized ratings, are in the sector and their collective market cap. Next, it juxtaposes the Portfolio Management Ratings of the ETFs and mutual funds in the sector. We think investors can gain an advantage with our forward-looking fund ratings since past performance is not a reliable predictor of future returns.
Figure 1 shows that 89 out of the 660 stocks (over 31% of the market value) in Information Technology ETFs and mutual funds get an Attractive-or-better Portfolio Management Rating.
The main takeaway from Figure 1 is that despite nearly a third of the market cap of the Information Technology sector consisting of Attractive-or-better rated stocks, ETF providers and mutual fund managers are allocating to the worst stocks in the sector.
Zero out 27 ETFs allocate enough to quality stocks to earn an Attractive-or-better Portfolio Management Rating. Mutual fund managers have not fared much better. Zero out of 147 mutual funds allocate enough of their assets to quality stocks to earn an Attractive-or better Portfolio Management Rating. ETF providers and mutual fund managers need to do a better job to justify their fees.
On a positive note, ETF investors have chosen wisely with over 89% of total net assets (TNA) in ETFs with a Neutral Portfolio Management Rating. This means that very little money is being invested in ETFs allocating to Dangerous-or-worse stocks. Mutual fund investors provide a contrasting picture with over 68% of TNA invested in funds with a Dangerous-or-worse Portfolio Management rating. Mutual fund investors need to perform due diligence when choosing a fund.
It is encouraging to see such a large percentage of total net assets allocated to ETFs with a Neutral Portfolio Management Rating, but as mentioned above, investors are disproportionately allocated to the worst mutual funds in the Information Technology sector.
Figure 1: Information Tech Sector: Comparing Quality of Stock Picking to Quality of Stocks Available
Sources: New Constructs, LLC and company filings
First Trust NASDAQ Technology Dividend Index ETF (TDIV) has the highest Portfolio Management Rating of all Information Technology ETFs and earns my Neutral Portfolio Management Rating. Columbia Seligman Global Technology Fund (SHGTX) has the highest Portfolio Management Rating of all Information Technology mutual funds and earns my Neutral Portfolio Management Rating.
PowerShares S&P SmallCap Information Technology Portfolio ETF (PSCT) has the lowest Portfolio Management Rating of all Information Technology ETFs and earns my Dangerous Portfolio Management Rating. T Rowe Price Global Technology Fund (PRGTX) has the lowest Portfolio Management Rating of all Information Technology mutual funds and earns my Dangerous Portfolio Management Rating.
Qualcomm (QCOM) is one of my favorite stocks held by TDIV and earns my Very Attractive rating. Over the past decade, Qualcomm has grown after-tax profits (NOPAT) by 23% compounded annually. Qualcomm has also increased its return on invested capital (ROIC) over this time from 19% in 2003 to 51% in 2013. The company has generated positive and increasing economic earnings every year since 2003. Despite this impressive and sustained profit growth, Qualcomm’s is undervalued. At its current price of ~$72/share, QCOM has a price to economic book value (PEBV) ratio of 1.2. This ratio implies the market expects Qualcomm to grow its NOPAT by only 20% over the remaining life of the firm. Looking at the past decade, Qualcomm has often grown NOPAT by more than this in just one year. Market expectations are overly pessimistic and investors should take note.
Amazon (AMZN) is one of my least favorite stocks held PRGTX and earns my Very Dangerous rating. Amazon is also on our Most Dangerous stocks list for October. Since 2009, Amazon’s NOPAT has declined by 12% compounded annually while its ROIC has fallen from 38% to just 4% in 2013. Many Amazon bulls disregard true profits and focus on Amazon’s reported $5.5 billion cash flow in 2013. However, as I’ve highlighted before, this cash flow is an illusion, and Amazon’s high capital efficiency days are behind it. Accounting methods for depreciation, stock-based compensation, capital leases, and off-balance sheet debt all offer loopholes that Amazon has exploited to inflate its cash flow numbers. In reality Amazon has seen billions in negative free cash flow for the past three years. To justify its current share price of ~$306/share, AMZN would need to increase its pre-tax margins to 5% and grow revenue by 20% compounded annually for the next 10 years. Expectations this high completely disregard that since 2011, Amazon’s NOPAT margins have declined and its revenue growth is slowing. Investors should steer clear of Amazon before the market sees through the company’s accounting tricks.
Many ETF providers and mutual fund managers do a poor job identifying quality stocks. Their funds allocate heavily to overvalued stocks like Amazon and don’t hold high quality stocks such as Qualcomm. These funds are not worth owning at any cost.
The emphasis that traditional research places on low costs is a positive for investors, but low fees alone do not drive performance. Only good holdings can. Don’t fall prey to the index label myths. Even “passive” investors should be analyzing the holdings of their funds.
Our Best & Worst ETFs and Mutual Funds for the Information Technology Sector report reveals our predictive ratings on the best and worst funds in the sector.
Kyle Guske II contributed to this report.
Disclosure: David Trainer and Kyle Guske II receive no compensation to write about any specific stock, sector, or theme.